Do you work extensively with Flask & Python? Here’s how we made Python Flask API 25x Faster!

How To Make Your Python Flask API 25x Faster
CTO at Decentro. Making fintech great again!
Table of Contents

I have been a big user of Flask for a very long time.
For people unfamiliar with Flask, it is a microframework for web and API development in Python, which is exceptionally lightweight and easy to integrate. However, this in no way implies that it can’t be used for big enterprise projects.
Now let’s say we’ve developed our Flask application, and we are ready to ship this to production (isn’t that every developer’s dream?). Our application is doing well, and we are getting thousands of hits every day on our application (every developer’s 2nd dream). We are happy to see that everything looks hail and hearty in Flask-land.
One fine day, you trigger an API hosted on your application and realize that it takes 3 to 4 seconds per API hit. You go ahead and blame the traffic and go about your day making your espresso and eating your avocado toast. You then come back to the seat and make another couple of hits, and even they take 3 to 4 seconds.
You keep your espresso down and think, “Hmmm…Something bad is brewing…” (pun definitely intended).
This very situation happened to me when our product manager came to me showing APIs that took 3-4 seconds, and I shrugged it off by saying it must be the traffic on the application. But then there was some merit to him pointing out, “Whatever might be the case, why should the customers suffer?”
The solutioning began, but you must know the root cause to get there. A detailed Root Cause Analysis (RCA) is required.
API Profiling
This is where API profiling comes in. Profiling helps identify bottlenecks choke points and find out code that can be optimized. Since I was using Flask, I used the profiler that came bundled with Werkzeug (Flask’s development server).
I just added these two lines to the application’s starting point app.py:
“`from werkzeug.middleware.profiler import ProfilerMiddleware
app.wsgi_app = ProfilerMiddleware(app.wsgi_app, profile_dir=’./profile’)“`
Doing this activity on the production environment could invite a minor time penalty and generate a bunch of .prof files as more and more API hits land on your server.
Files will be named something like POST.v2.entity.operation.9824ms.1642415167.prof
The first two parts are the RESTful method used and the endpoint (/v2/entity/operation). The third part is the turnaround time (TAT), and the last bit is the time in epoch format.
This file contains the treasure that you have been searching for, but you need a tool to unlock it. In comes snakeviz!
This serpentine tool unravels the treasure on your web browser and lets you go through different methods being called in your API hit, and it shows how much time each bit takes.
Simply run:
“`snakeviz <filename>“`
I ran it, and it opened the following screen.
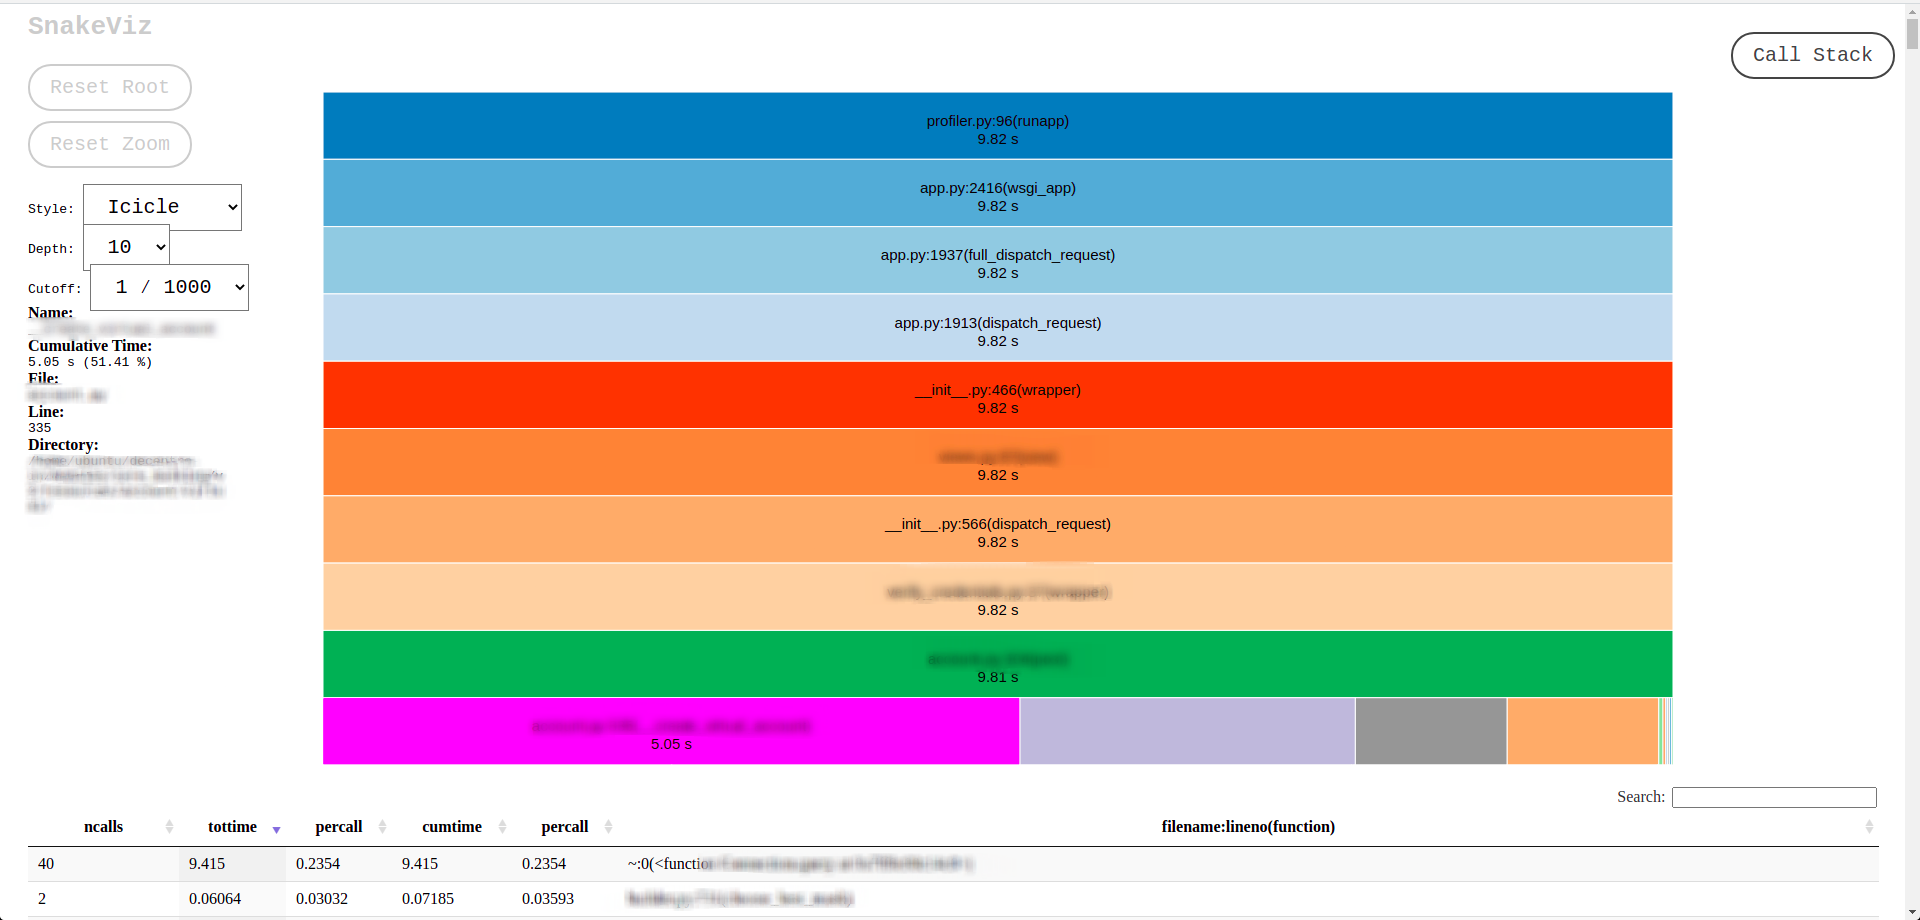
These bright and colorful bars show individual functions that are called while making the API call,
Let’s zoom in a bit.
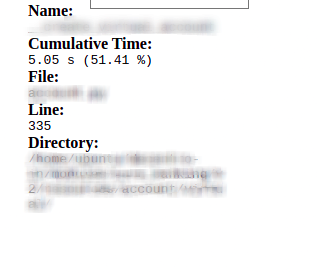
Here you see that the function __perform taking 51% of the whole API TAT.

Let’s go deeper by just clicking on the __perform:
Ooooohhh, now we see that there are two functions that are running SQL queries, and those queries themselves are taking up a majority of the time.
This is the root cause, which is causing the bottleneck.
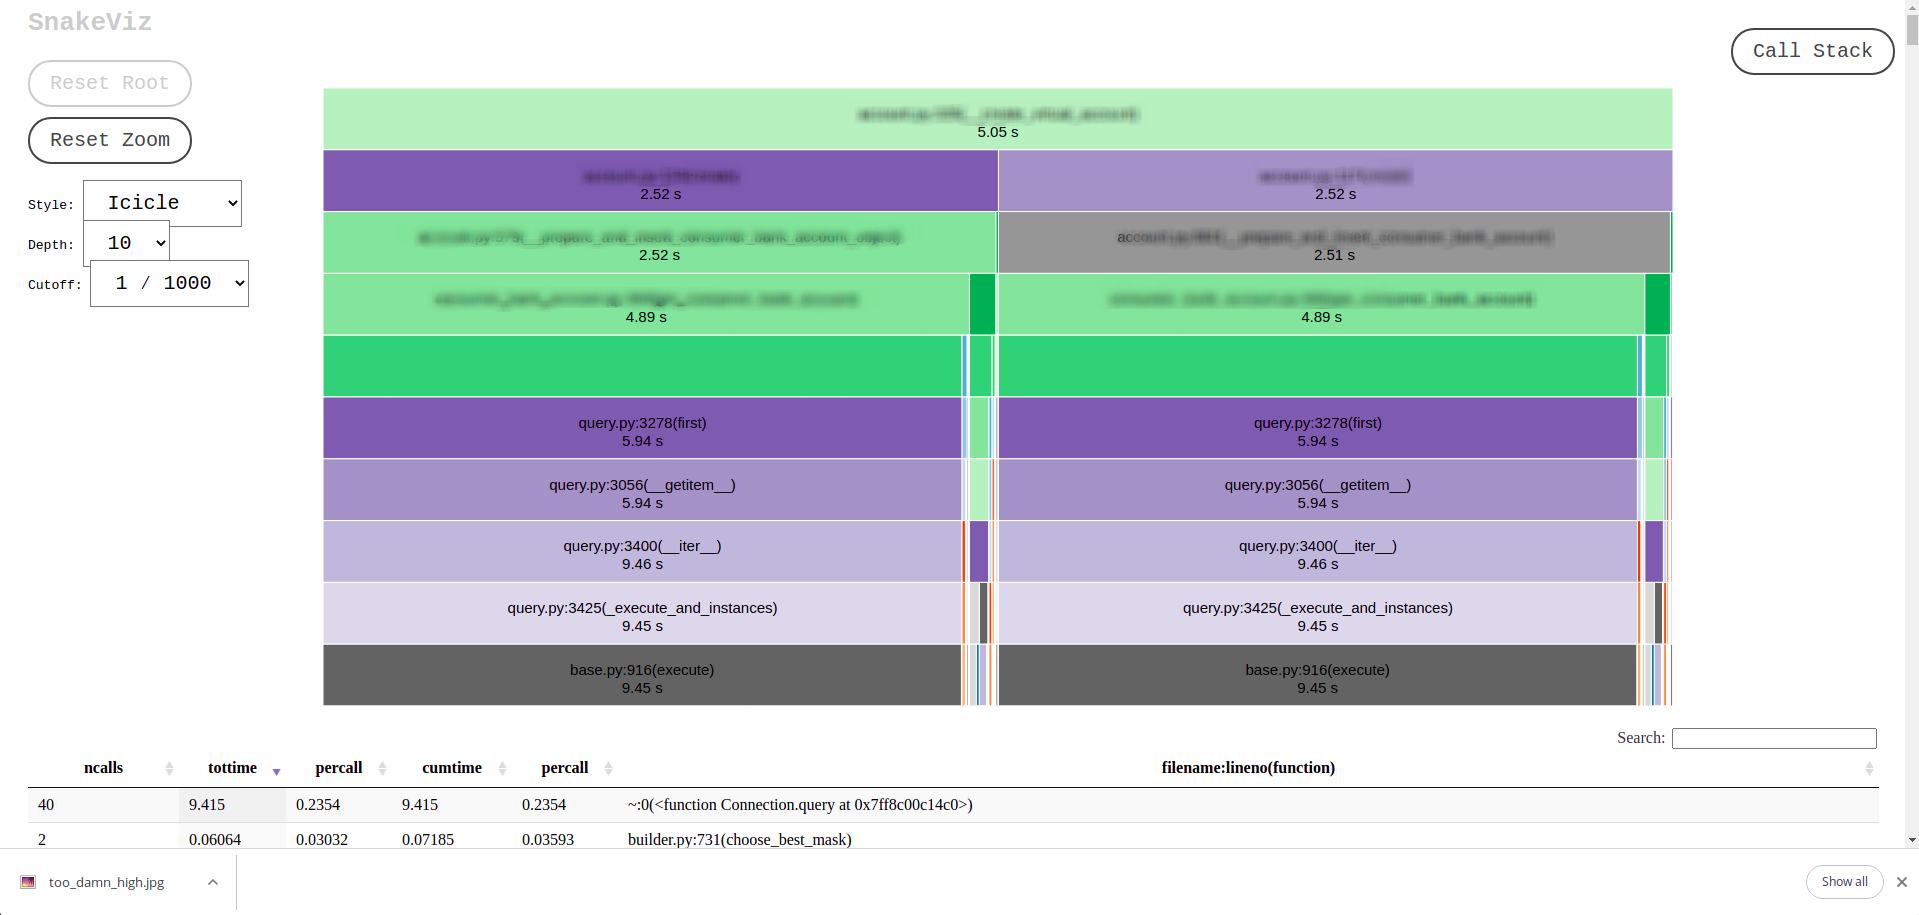
Next, we started optimizing these queries, and that solved the problem. Our query times were reduced from 5.05 seconds to 180 milliseconds using indexes on the columns being queried, and the overall TAT also got reduced. This means we got a ~25x performance boost.
Indexes to the Rescue
Now let’s talk about how we figure out what to index?
For each API that was being used, I went out and searched for the queries that were being executed on the MySQL database. I was searching for the ‘where’ clause in all of them, and that is where (another intended pun) you will get the column(s) that can be indexed. It’s not that tedious a process.
The column in the where clause of a query is the part which the database engine searches on (aka a filter). For example:
“`SELECT * FROM Suppliers where city=’Tokyo” “
In the above example, the city is the column on which the search will be performed. If we put an index on the city column, the database will internally use a data structure to order the city names in that column to be efficient and fast to query.
This is where (the puns are just flowing today, aren’t they?) the performance boost comes from. So an index can be applied to such a frequently accessed column, and a visible decrease in the query TAT can be immediately observed.
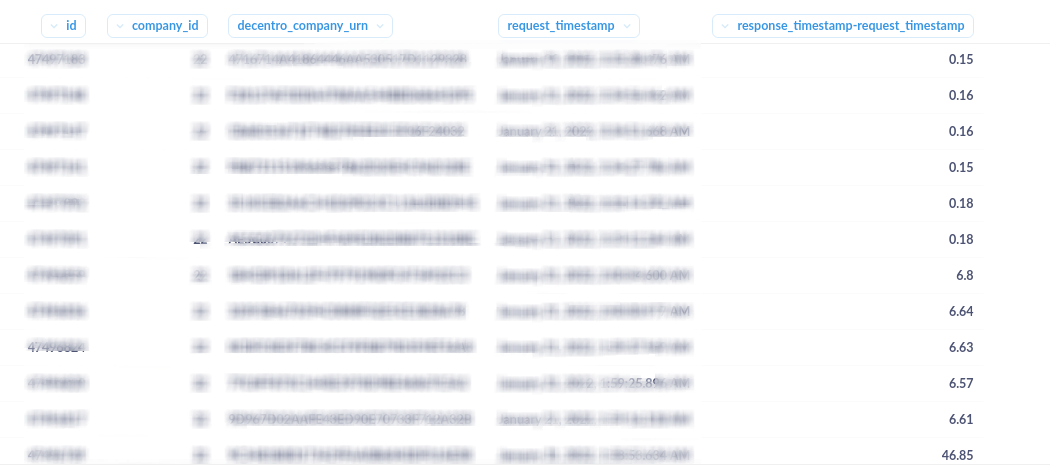
Here you can see the reduction of TAT in the “response_timestamp-request_timestamp” column, which is in seconds.
What we Learnt
All was fine again in Flask-land!!
What I learned from this process is that diagnosing the root cause of an issue is very important and, as mentioned above, can be done without even breaking a sweat. An API profiler is a vital tool if you wish to find and get rid of choke points within your application flows. If you have any queries (You already know it’s a pun), please feel free to post a question in the comments. I will be more than happy to address them.
There are many other profilers, services, and technologies like New Relic and Instana that can help identify the bottlenecks, but what I did was to use the one that was easily available and did not cost me anything extra to solve the issue at hand.
On another note, feel free to explore the other tech blogs our engineering team has penned ranging from processing bulk payouts, API serialization, and MYSQL isolation levels! Got an idea for a topic? Let us know and stand to get featured in our blog!
That’s all, folks.
P.S. In the images and screenshots, we have blurred out the details related to Decentro, but we have kept the time-related data for reference.


Comments are closed.