“Data is the new oil”. We have all heard this adage but how does it fit in the startup ecosystem? Let’s find out
Usage of Metabase for making a data-driven product
CTO at Decentro. Making fintech great again!
Table of Contents

“Data is the new oil”. We have all heard this adage but does it fit in the startup ecosystem? The statement might be true for large enterprises which have multiple verticals and many departments looking at metadata or transactional level information to make sense of it, but what about a growing startup?
Is Metabase the answer?
It’s wise to start early and bloom according to the customer or market requirements when they come.
As mentioned earlier, large enterprises might have data engineers setting up pipelines, and dedicated personnel preparing dashboards and presentations using the data collated from the multiple divisions of the organisation, but a startup has limited resources in terms of man-hours and funds.
This is where our trusty friend Metabase comes in. Metabase is a business intelligence tool that lets you access your data in a read-only manner. The only setup required is getting the docker up and running, then following the steps to add your database. No engineers or extra licensing costs are involved.
Let’s dig deeper (for the “oil”)
We at Decentro have a central RDBMS database containing transactional data. This makes querying the data easier and extracting information a piece of cake. Metabase sits on a separate instance and has read-only access to this database.
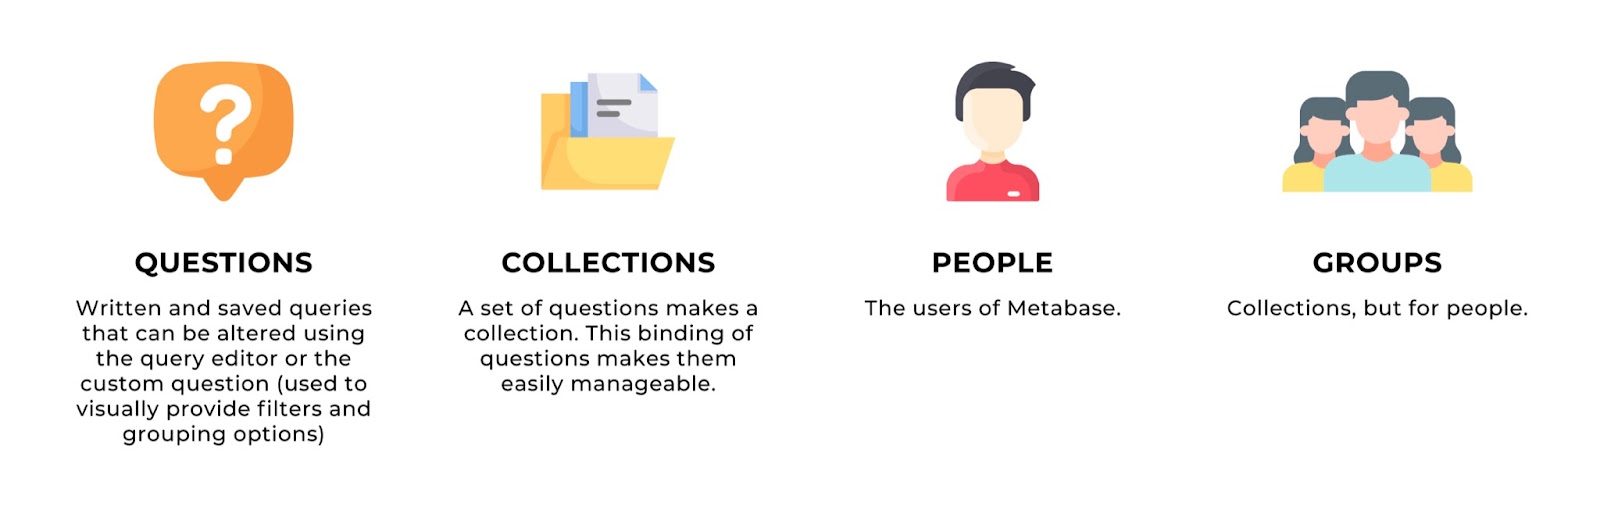
Metabase has 4 important components –
- Questions – Written and saved queries that can be altered using the query editor or the custom question (used to provide filters and grouping options visually)
- Collections – A set of questions makes a collection. This binding of questions makes them easily manageable.
- People – The users of Metabase.
- Groups – Collections, but for people
Metabase allows people to be self-onboarded using Google SSO, which works very well for us at Decentro. Once a person is onboarded, we assign them a group, and the group, in turn defines the accesses to the tables and collections they will have. The permissions can be to view questions in a collection or curate them simply. Groups have policies to manage the access to collections and questions that the admins manage very stringently.

In the image above, you can see the collections in the left-hand side column and questions belonging to a particular collection.

In the image above, you can see the groups and people of a Metabase installation
Based on this framework, we have internally divided people into 3 groups
- Operations and Sales
- Product
- Developers
The Operations team requires access to dashboards and questions that deal with customer success. Issues like Success rate dipping below a certain threshold, transaction-related issues, and customer billing. Similarly, the Sales team can check how their clients are doing using the data from Metabase.
The Product team needs to have a look at turnaround times, success metrics, and data anomalies. All of these fit in very well with the Metabase way of doing business. It helps the team preemptively check for issues or inefficiencies in our customers’ APIs.
Developers are provided access to Metabase when working with the operations team to debug issues on production servers or do configuration checks or root cause and corrective analyses (RCCA). Since developers work with SQL daily, they can write queries to solve these problems and have a window to the production database.
As you can see the efficiency of the whole Decentro team is benefitted from Metabase.
Why is Metabase awesome?
Now that we have seen how to tap into efficiency, let’s dive deep into the why.
Visualizations. Boom. Just, effortless visualizations.

Scenario: I just fetched some information from the database but want to make a graph.
Solution: A few clicks in the visualization tab, and it’s done.
No pesky configuration options. Just a clean interface.
Let’s take a closer look at a real-time scenario for better visualization,
Below is a query to fetch Transactions per second for one of the servers. This data represents the traffic on that server and is originally received in tabular format.

But tables are not very intuitive. However, charts are. So I click on the visualisation tab and switch my mode from data to visualization, and voila!

Bar graph
Now, this looks cool and intuitive. I have chosen a bar graph to analyze the TPS data more efficiently. But what if I wanted to further customise it to my liking?
There are options such as setting a goal line if you want to set targets, changing colors (not shown in the screenshot below), showing a trend line, and many more, for each chart type. All the customization is focused on incorporating efficiency and a level of intuitiveness with each chart.
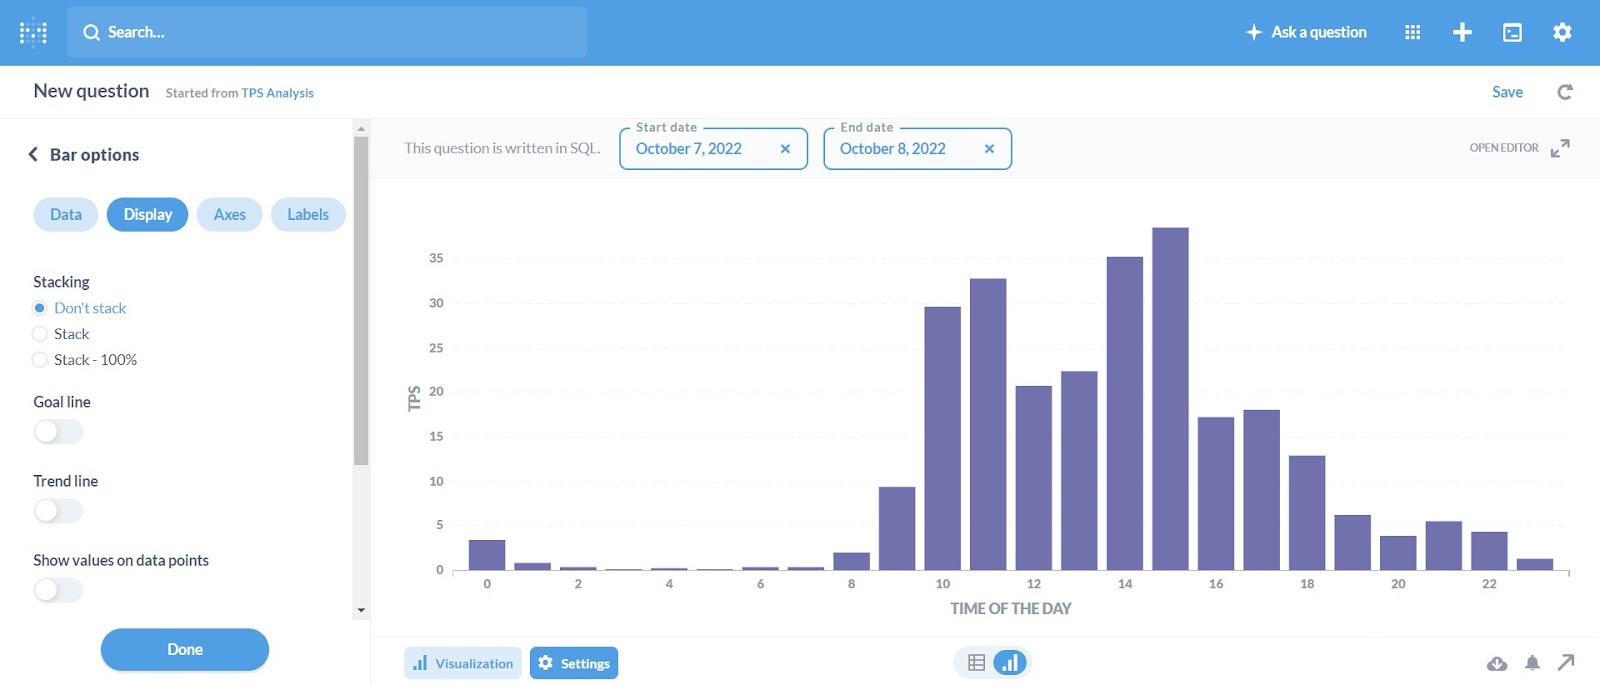
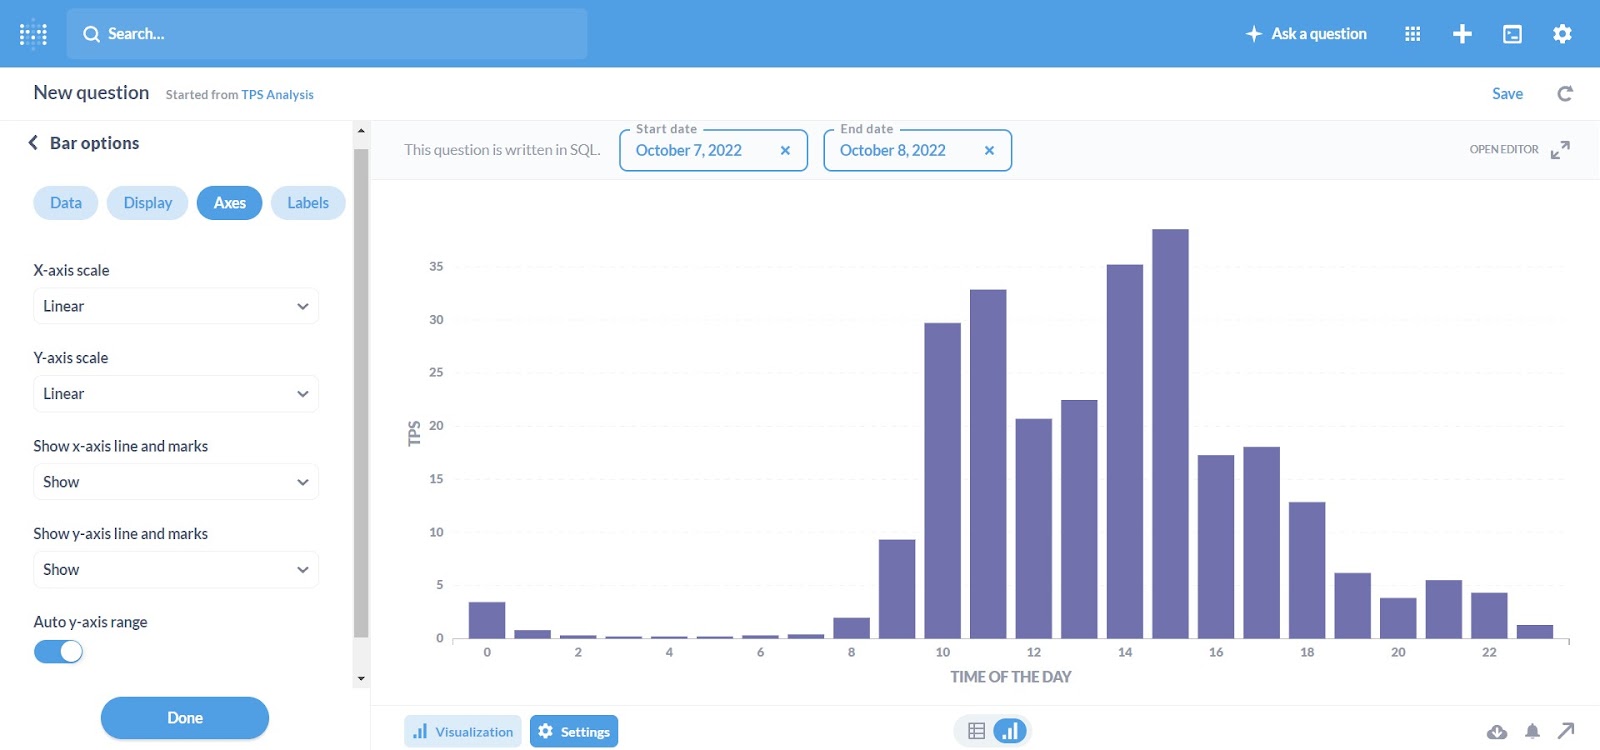

As you can see, my chart now looks good enough for our team to consume and infer information from.
Conclusion
Metabase is a very important tool in the arsenal of a growing startup. Its impact might be low in the beginning, but as time passes on it becomes more and more valuable. Data-driven product and engineering decisions empower Decentro to understand customer pain points and work on them without the customers conveying them verbally. Metabase is the silent aid for such decisions.
In case it spikes your interest, our engineering team at Decentro has penned more tech blogs to satisfy the developer within you. Be it why we moved to Kong API Gateway from NGINX, or a pocket guide on API Request Validation.
We’ll see you next time with yet another tech story!