The main types of risk in microfinance explained: credit, liquidity and operational risk, how MFIs measure each, and how they’re managed.

Types of Risk in Microfinance: Credit, Liquidity, Operational

A true blue millennial trying to engineer her full time-career around the world of content. How cliché is that?
Table of Contents

| Summary The three main types of risk in microfinance are credit risk, liquidity risk and operational risk. MFIs also face interest rate, market, strategic, reputational and regulatory risks, but these three cause most losses. Credit risk: the risk that borrowers do not repay their loans on time, in part or at all. Liquidity risk: the risk that the lender cannot raise or hold enough cash to meet its own payments and fund new loans. Operational risk: the risk of loss from failed internal processes, people, systems or external events. |
The Three Risks at a Glance
| Risk | What it means | Main cause | Key metric | Main control | Loan-lifecycle stage |
| Credit risk | Borrowers fail to repay on time, in part or in full | Over-indebtedness, income shocks, weak underwriting | PAR 31–180; gross NPA ratio | Bureau-checked underwriting, income-based repayment limits, early follow-up | Underwriting through collections |
| Liquidity risk | The lender cannot meet its own payments or fund new loans | Funding squeeze, slow collections, covenant breaches | Cash plus undrawn lines against the next three months’ outflows; collection efficiency | Diversified funding, collection discipline, stress tests | Funding, disbursement and collections |
| Operational risk | Losses from failed processes, people, systems or events | Field-agent fraud, manual KYC, technology and compliance gaps | KYC mismatch rate; audit findings per branch; complaints per 1,000 loans | Digitised and auditable workflows, training, surprise audits | Onboarding and collections, though it can arise at every stage |
FY25 to 2026: from stress to recovery
Microfinance asset quality has recovered since the FY25 stress peak, but loan volumes and borrower numbers are still below their highs. Loans 31–180 days overdue fell from 6.3% of the portfolio at March 2025 to 1.6% at June 2026, according to MFIN’s Q4 FY26 and Q1 FY27 Micrometer releases.
FY25 (April 2024 to March 2025): the stress case
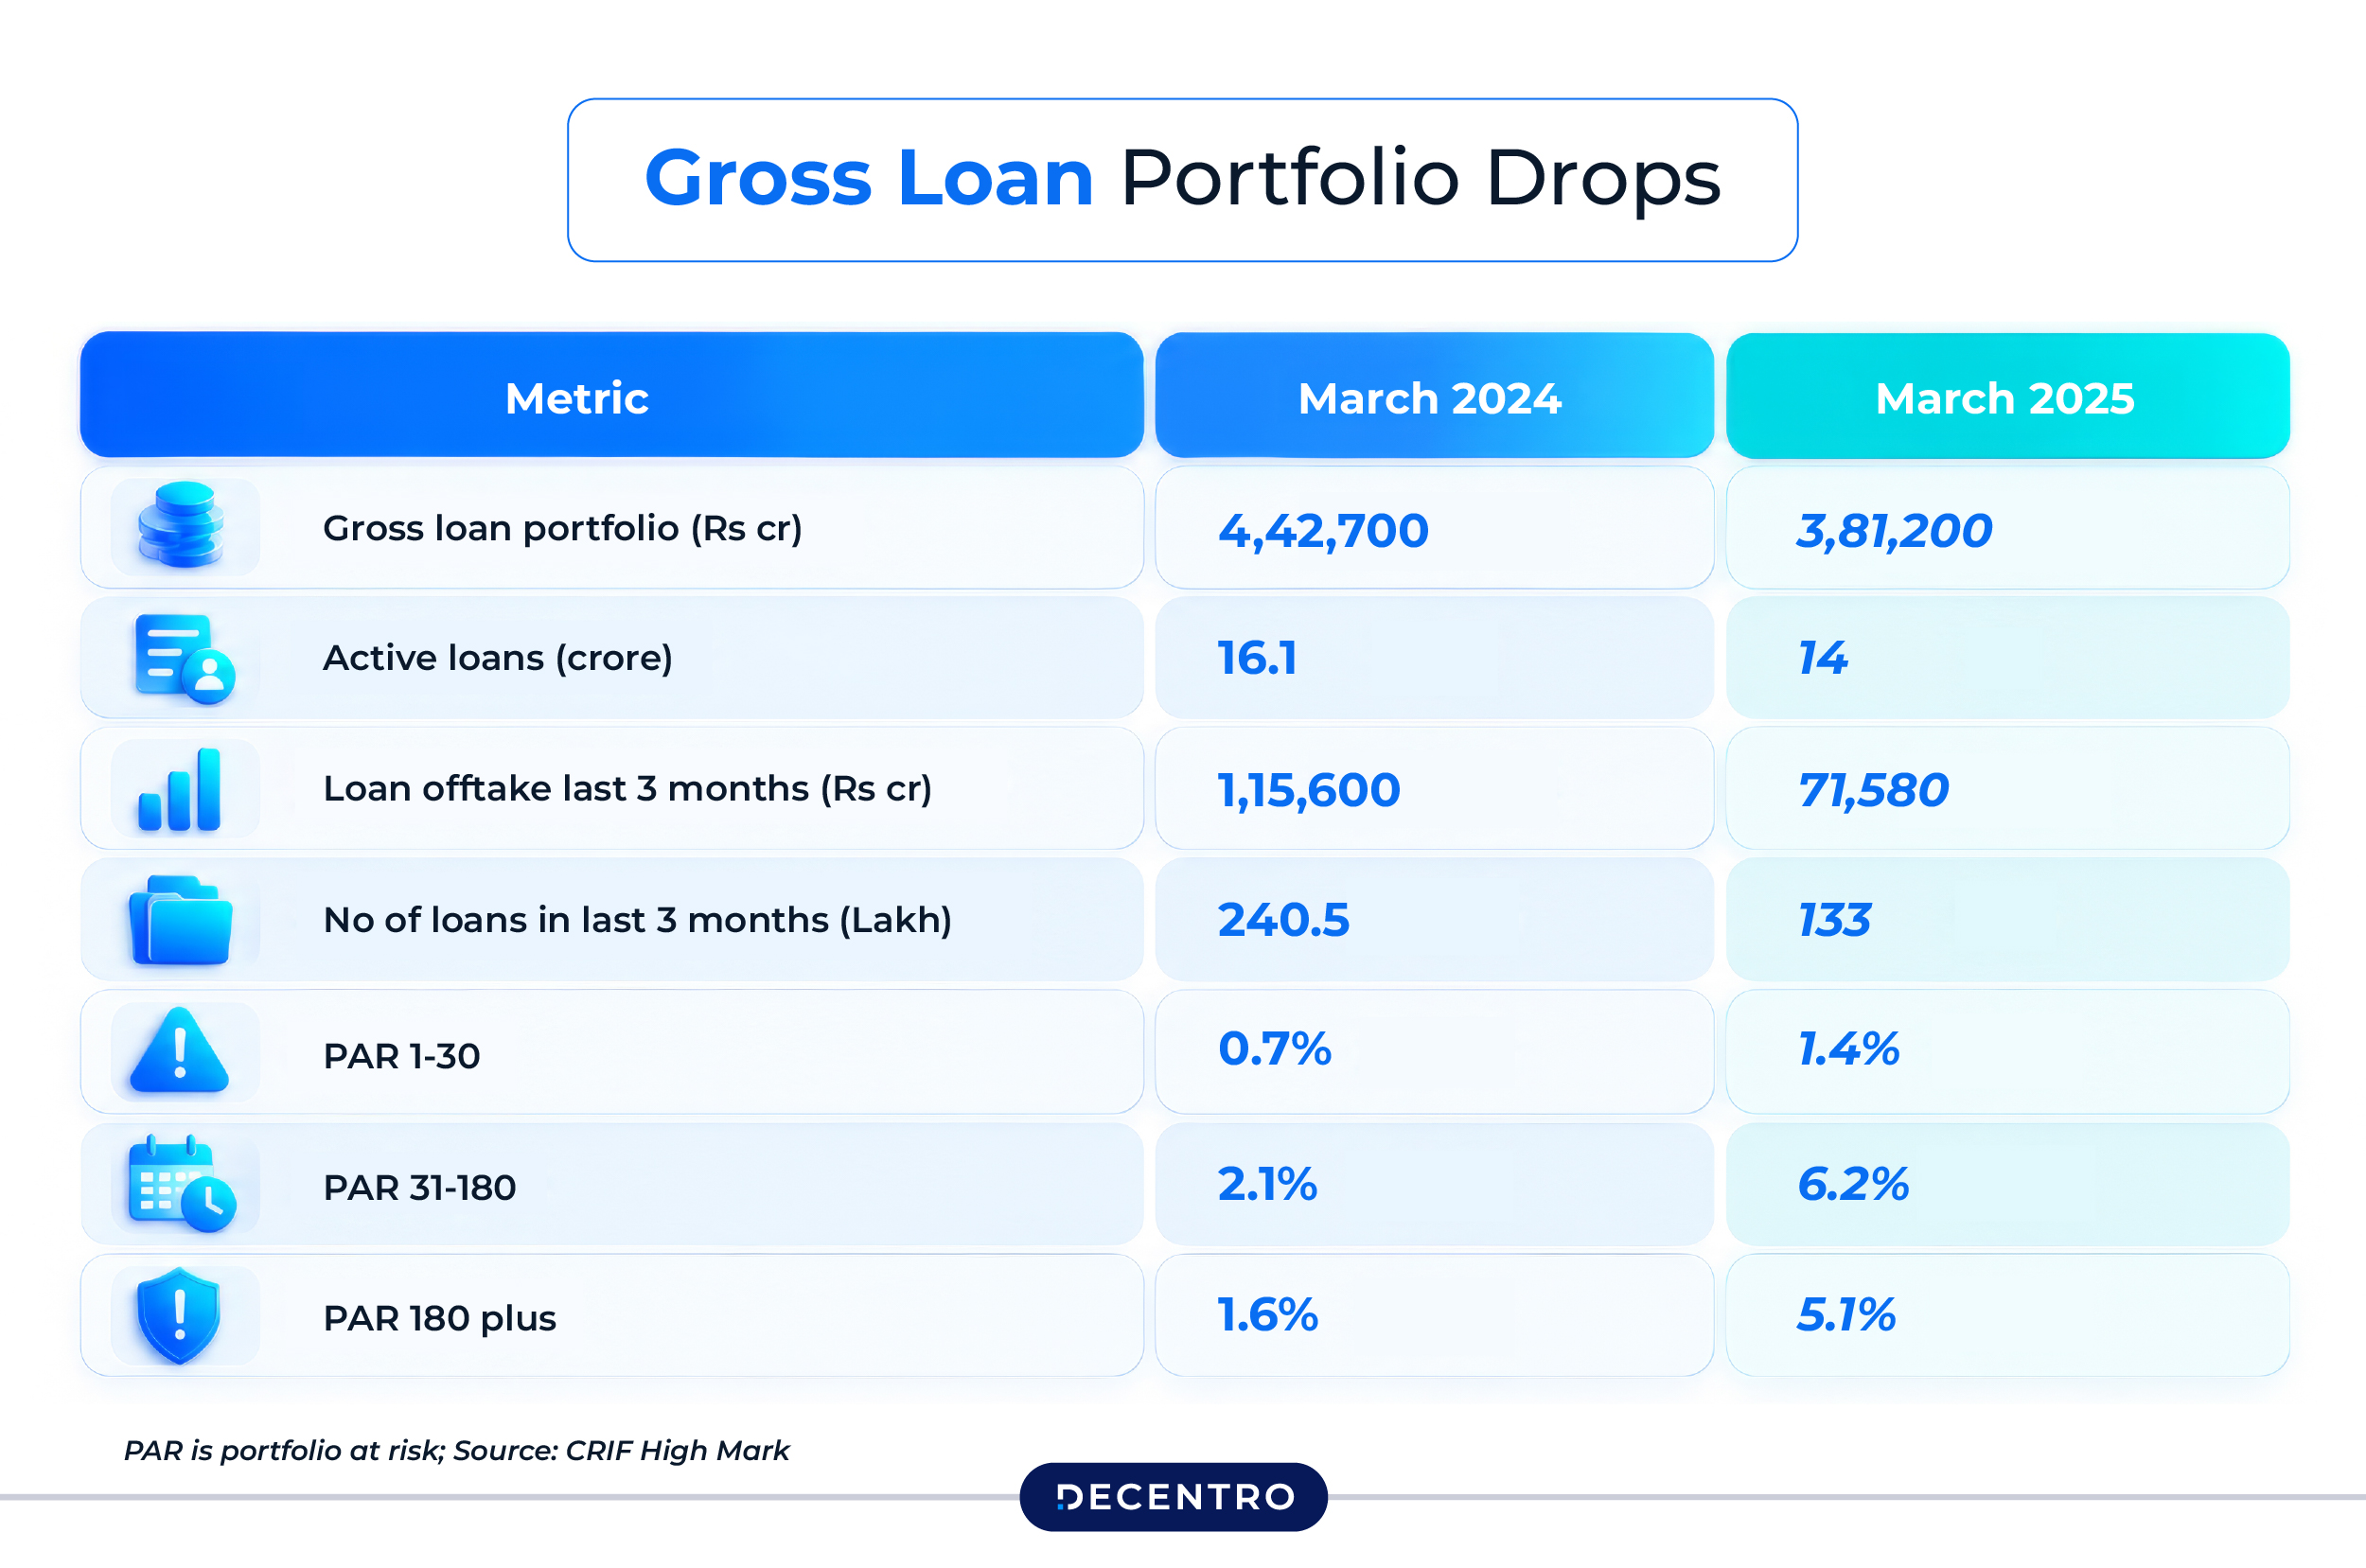
- The gross loan portfolio fell to ₹3.75 trillion at March 2025 from ₹4.24 trillion a year earlier (MFIN data via Business Standard).
- PAR 31–180, the share of loans 31 to 180 days overdue, rose from about 2% at March 2024 to about 6% at March 2025.
- Gross NPAs reached nearly ₹55,000 crore, about 14.8% of gross loans, by March 2025.
- The RBI put the gross NPA ratio of NBFC-MFIs at 4.1% at March 2025, up from 2.0% a year earlier, and their return on assets and equity turned negative in FY25 (Business Standard). The two NPA figures differ because they cover different lenders and definitions.
- MFIN linked the deterioration to heatwaves, external incitement against repayment, over-leveraging and the Karnataka regulatory issue.
- Credit to the sector then fell for six straight quarters, by 9.3% in H1 FY26 (April to September 2025), and active borrowers dropped by 78 lakh (RBI FSR, December 2025).
2026: The Recovery
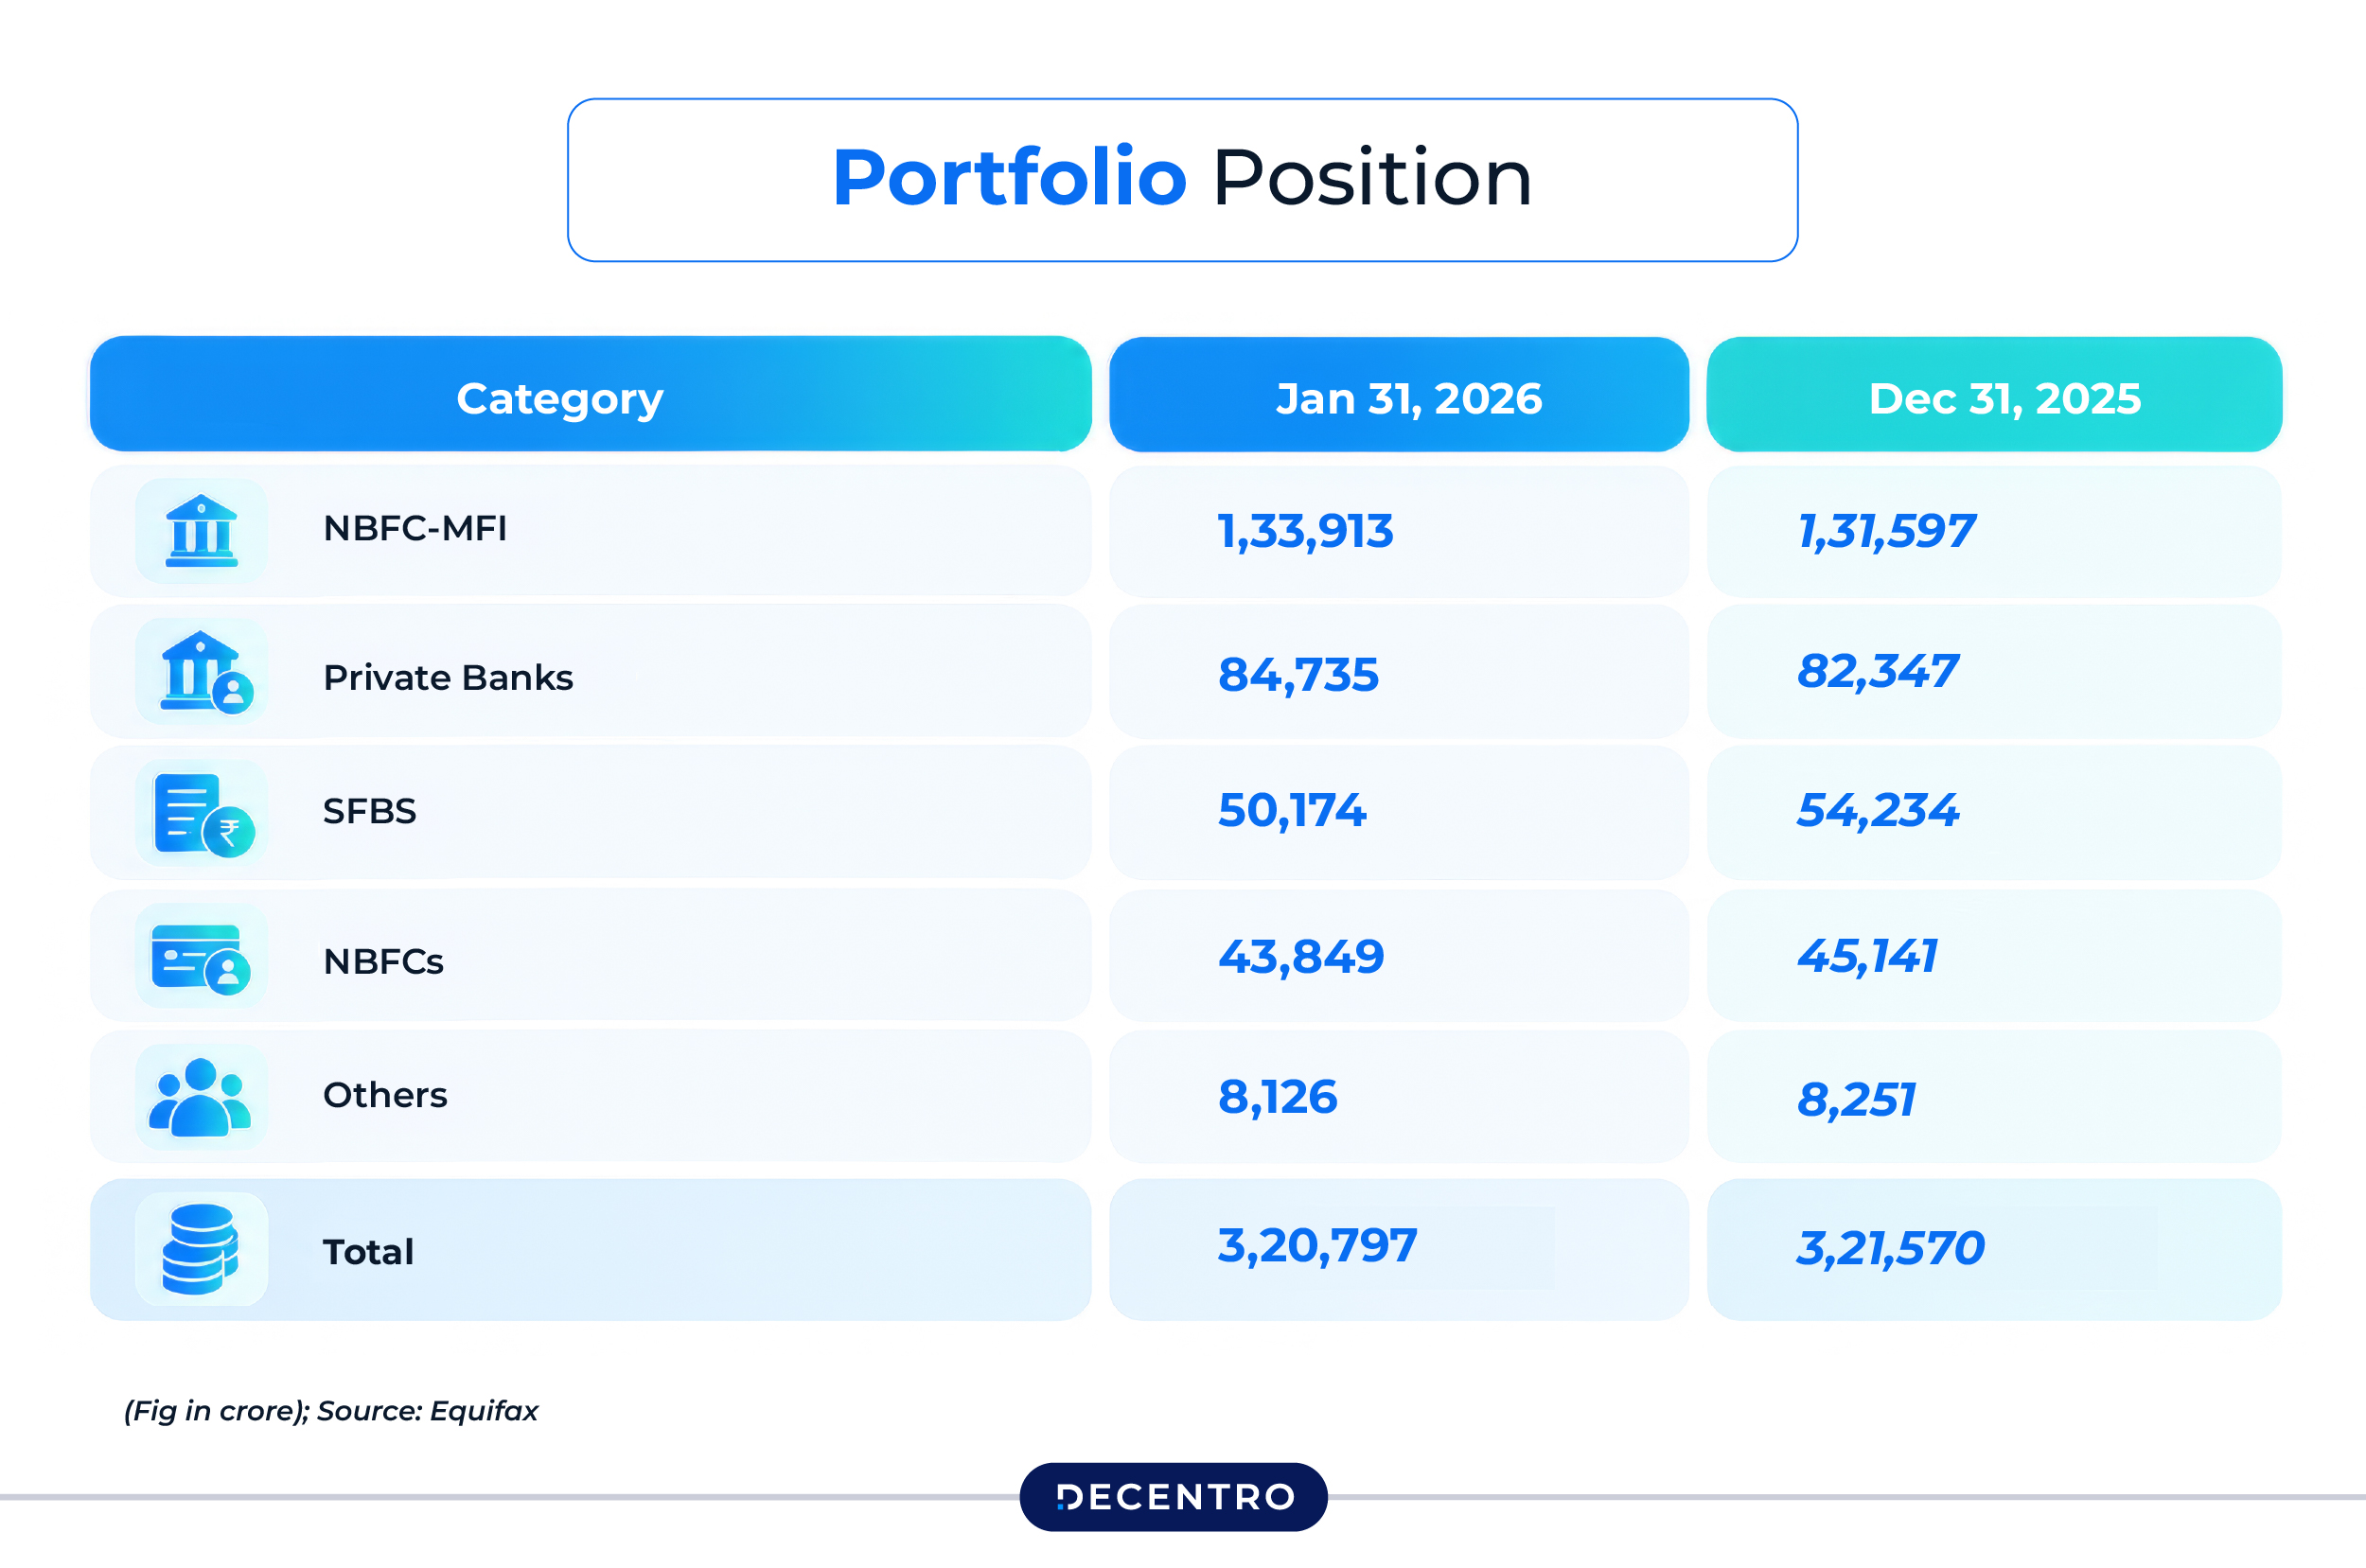
Lending turned the corner in the March 2026 quarter (Q4 FY26). The loan book rose more than 3% on the previous quarter, ending seven quarters of contraction, on the highest quarterly disbursement in seven quarters (₹77,524 crore). Growth continued in the June 2026 quarter (Q1 FY27), and NBFC-MFIs now hold 44.3% of the industry portfolio.
| Indicator | March 2025 (FY25 stress) | March 2026 (FY26 end) | June 2026 (Q1 FY27) |
| Gross loan portfolio (MFIN) | ₹3.75 trillion | ₹3.25 trillion | ₹3.29 trillion |
| PAR 31–180 (MFIN) | 6.3% | 2.0% | 1.6% |
| Quarterly portfolio direction (MFIN) | Fourth straight quarterly fall | First rise, over 3% | Further rise, 1.1% |
| Borrowers with loans from 3+ lenders (RBI) | 11.7% | 9.7% | – |
The RBI’s June 2026 Financial Stability Report confirms the turn: microfinance credit grew for the first time after seven quarters of decline, and 31–180 days past due fell for the fifth successive quarter.
What the Recovery Does Not Mean
- The book is still smaller. The June 2026 portfolio of ₹3,28,708 crore is 6.9% below a year earlier. MFIN says part of the gap is loans moving from microfinance to retail reporting, mainly at banks, whose reported portfolio fell 28.5% year on year.
- There are fewer borrowers. The RBI says the borrower base shrank by 22.7 lakh in the March 2026 quarter. CRIF High Mark data show live borrowers down from 8.0 crore to 6.6 crore between June 2025 and June 2026 (Infomerics).
- Growth leans on bigger loans and repeat borrowers. The average new-loan ticket was about ₹62,000 in June 2026 against ₹53,800 a year earlier, and 57% of Q4 FY26 originations went to existing borrowers of the same lender.
- Recovery is uneven. West Bengal’s PAR 31–180 was 2.0% in June 2026 against 1.6% nationally, while Karnataka improved from 12.5% to 1.3% over the year.
- Concentration remains. The top ten states hold about 83% of the portfolio, led by Bihar, Uttar Pradesh and Tamil Nadu.
What Is Risk in Microfinance, Really?
At its core, risk in microfinance is the possibility that something disrupts the smooth flow of money from lender to borrower and back again. Because microfinance serves low-income, often informal-income households with no collateral, the margin for error is thinner than in traditional banking. A single missed harvest, a local political disruption, or a poorly trained field agent can ripple through an entire portfolio.
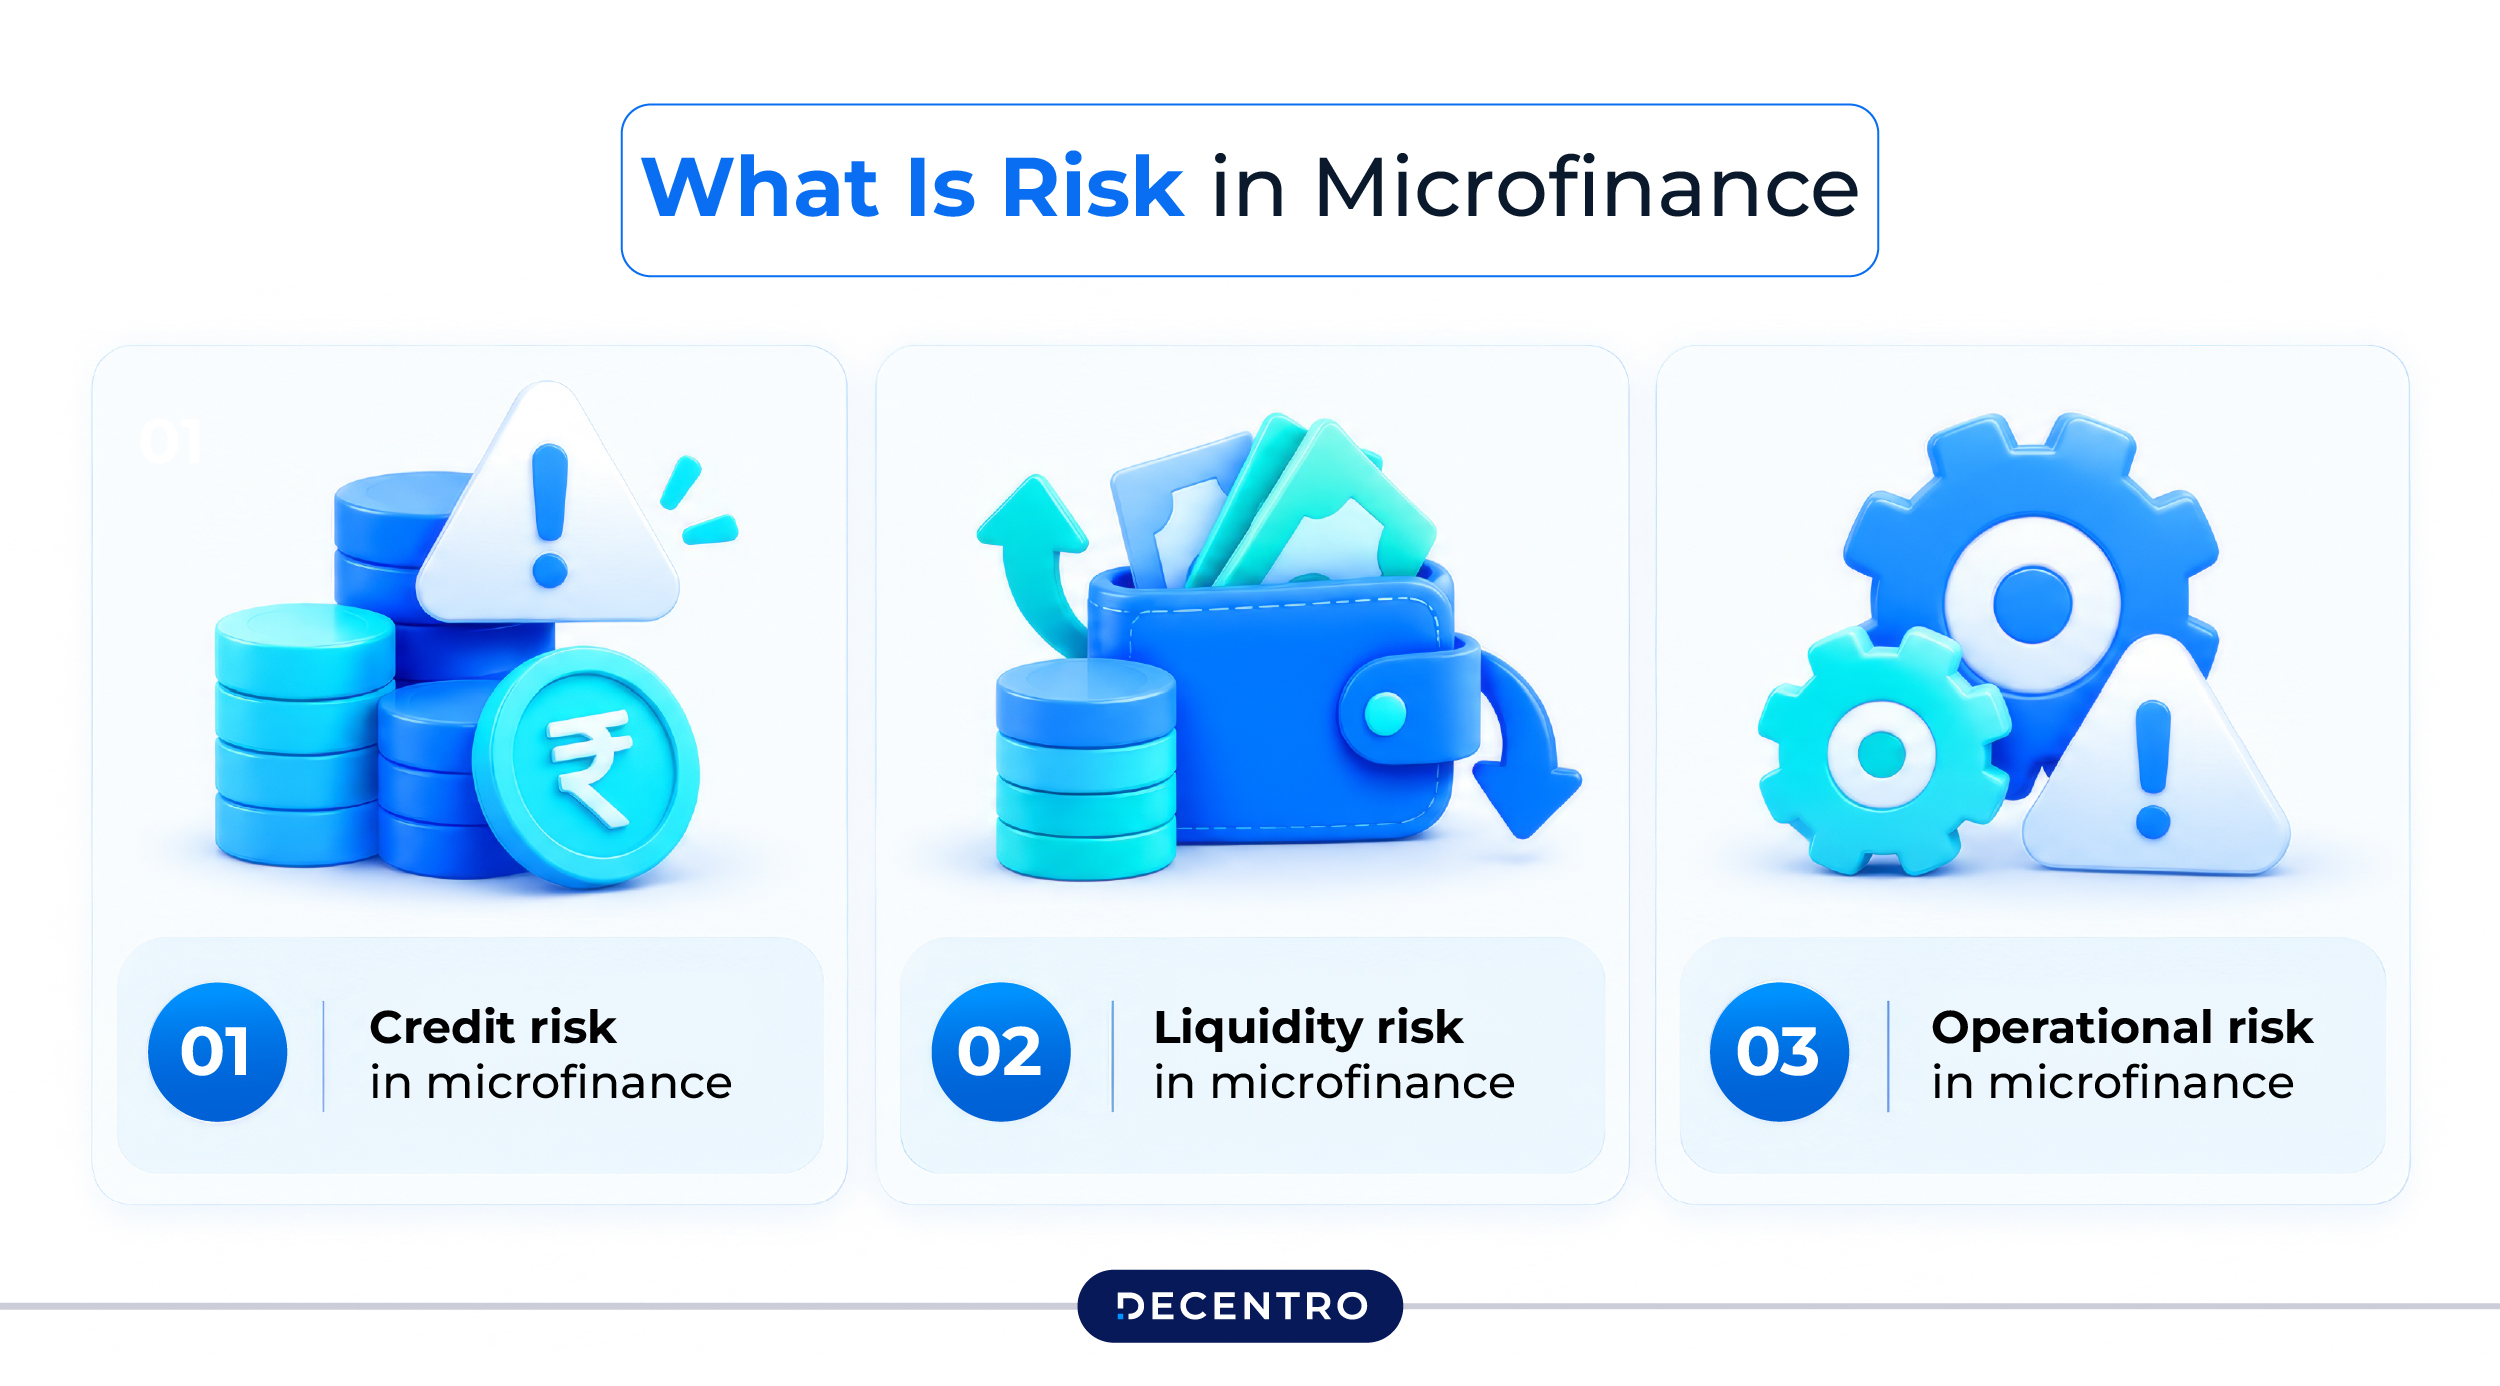
Broadly, risk in this space falls into three buckets that every founder and risk officer should be fluent in:
- Credit risk in microfinance, the chance that borrowers will not repay.
- Liquidity risk in microfinance, the chance that the lender itself runs short of cash to meet its own obligations.
- Operational risk in microfinance, the chance that internal failures, whether human, process, or technology-driven, cause losses.
Let’s unpack each one.
Credit Risk in Microfinance
What it is
Credit risk is the risk that a borrower fails to repay their loan on time, partially or at all. This is the most talked-about risk in the sector, and for good reason. Since microfinance loans are typically unsecured and given to people with unpredictable, cash-based incomes, the probability of default is naturally higher than in secured retail lending.
Is credit risk rising right now?
No. As of mid-2026, credit risk is declining in headline measures, but it remains structurally high. The evidence cuts both ways.
Easing
- PAR 31–180 was 1.6% in June 2026, against 5.6% a year earlier and a peak of 6.3% at March 2025 (MFIN).
- The share of borrowers with loans from three or more lenders fell to 9.7% at March 2026 after a marginal uptick at September 2025, and the RBI reports 31–180 days past due falling for five straight quarters (RBI FSR, June 2026).
- Exposure to borrowers with two or fewer lenders rose from 73.1% at March 2025 to 80.9% at June 2026 (CRIF High Mark, via Infomerics).
Still live
- The stock of old bad loans is large. CRIF puts PAR 180+ including write-offs at 16.3% at March 2026, against 9.1% a year earlier.
- Growth is leaning on bigger tickets (about ₹62,000 on new loans) and repeat borrowers (57% of Q4 FY26 originations), which can rebuild over-leverage if underwriting slips.
- Stress is uneven. West Bengal’s PAR 31–180 was 2.0% in June 2026 against 1.6% nationally, and the top ten states hold about 83% of the portfolio.
- MFIN’s June 2026 note flagged a weaker monsoon forecast and the West Asia conflict as risks to rural incomes. Its September 2026 note says rains have been better than expected outside Rajasthan.
What Drives Credit Risk
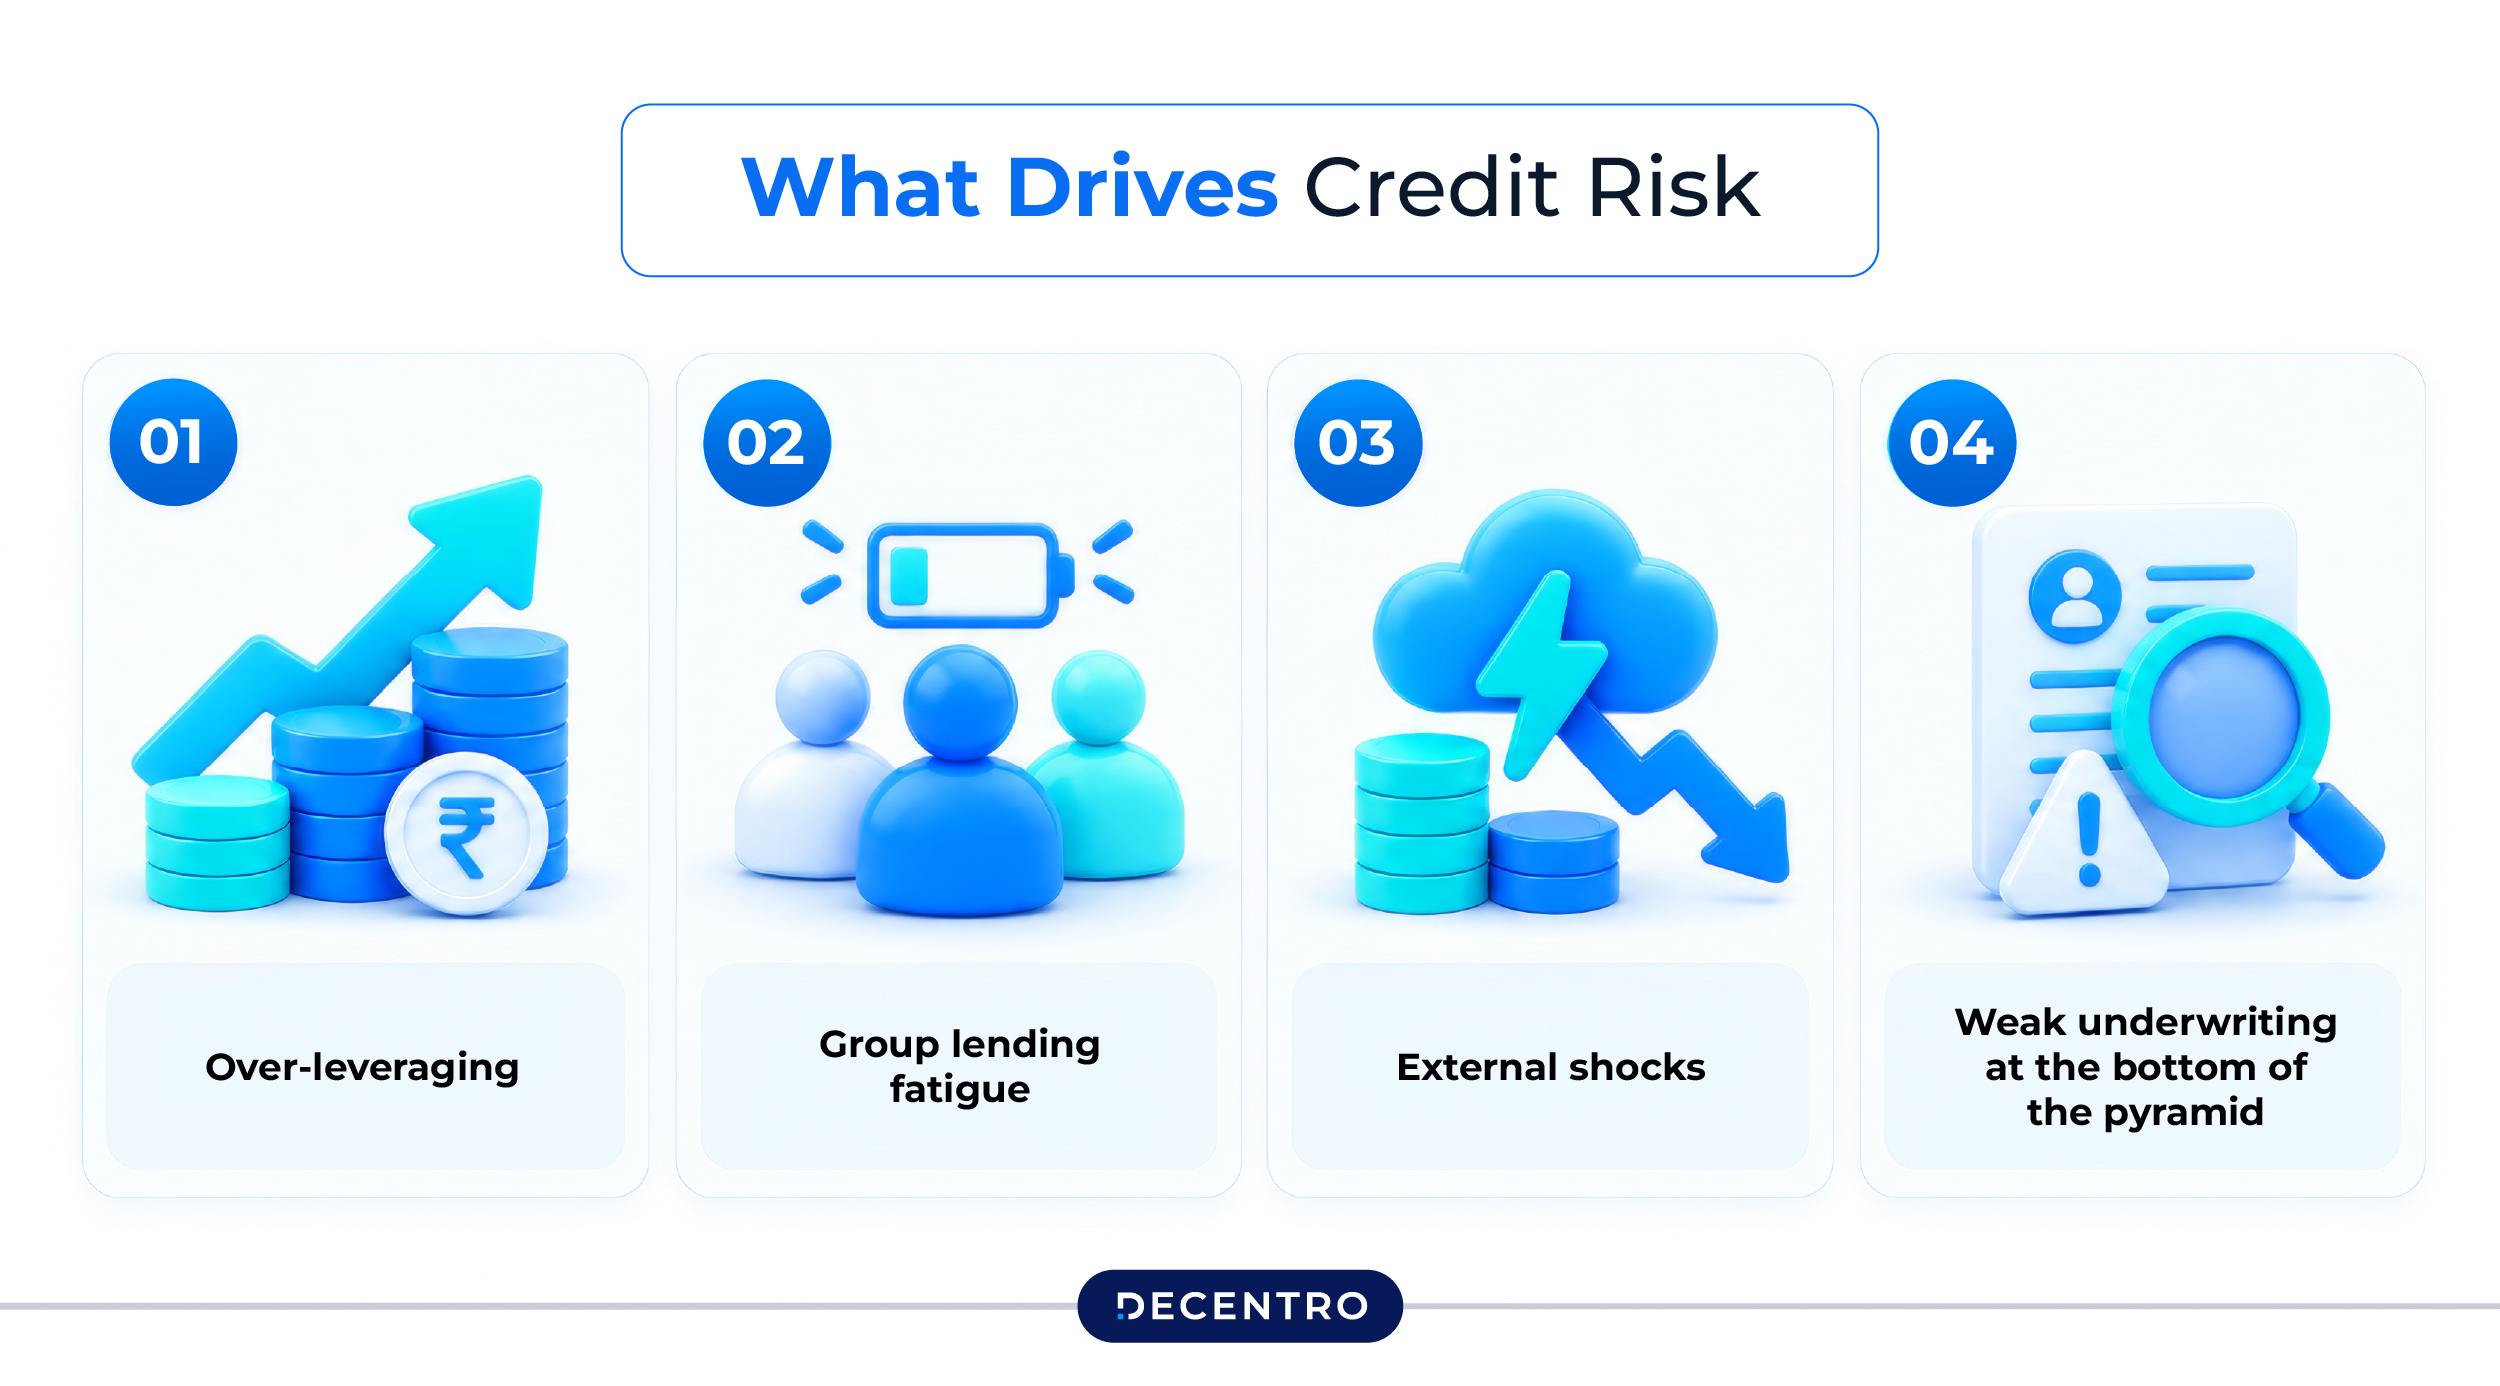
- Over-leveraging: many borrowers took loans from four, five or more lenders at once, stretching repayment capacity far beyond what any single lender could see. MFIN’s guardrails cap borrowers at three lenders from April 2025 and set a ₹2 lakh ceiling on total indebtedness.
- Group lending fatigue: the Joint Liability Group (JLG) model, where a group vouches for each member, showed strain in FY25. When one member defaults, peer pressure alone no longer holds the group together.
- External shocks: heatwaves, state-level regulatory disruption (the Karnataka issue in FY25) and campaigns urging borrowers not to repay all fed delinquency.
- Weak underwriting at the bottom of the pyramid: self-reported income and manual verification leave gaps that sophisticated borrowers or fraudulent applicants can exploit. The RBI’s October 2024 actions cited improper assessment of household income and repayment obligations.
The Process Of Managing Credit Risk
- Assessment: verify identity, income and existing debt before disbursing, ideally by pulling credit bureau and KYC data rather than relying on paperwork alone.
- Pricing and structuring: set interest rates and repayment schedules that match real cash flow, keeping total household repayments within the RBI’s 50% of monthly income limit.
- Monitoring: track early warning signs such as partial payments, missed EMIs or a spike in loans from one geography.
- Recovery and resolution: follow up with borrowers who fall behind through a clear, compliant process, before the account slips into deeper delinquency.
Credit risk is not just about individual bad loans. It compounds. A rising NPA book pushes up provisioning requirements, which eat into capital and then limit how much a lender can disburse next quarter. That is the pattern across FY25 and FY26, when portfolio contraction followed asset quality deterioration.
How To Measure Credit Risk in Microfinance
Measure credit risk at two levels: how much of the book is overdue and what it costs, and whether borrowers can afford what they owe.
Portfolio quality and loss metrics
| Metric | Formula | What it tells you | Reference point |
| PAR 31–180 | Principal outstanding on loans 31–180 days overdue ÷ gross loan portfolio | Mid-stage delinquency; MFIN’s headline quality measure | 1.6% (June 2026); peak 6.3% (March 2025) |
| PAR by bucket (1–30, 31–90, 91–180) | Same formula for each overdue bucket | Where stress sits; the 1–30 bucket is the earliest warning | PAR 31–90 0.8%, PAR 91–180 1.2% (March 2026) |
| Gross NPA ratio | Loans overdue 90 days or more ÷ gross loans | Loans classed as non-performing | NBFC-MFIs 4.1% (March 2025, RBI) |
| Roll rate | Share of loans in one overdue bucket that move to the next bucket the following month | Speed of deterioration; a leading indicator of NPAs | No published benchmark; track against your own history |
| Collection efficiency | Amount collected ÷ amount due in the period | Repayment behaviour and early stress | Track monthly by branch and loan cycle |
| Credit cost ratio | (Provisions + write-offs) ÷ average loan portfolio | Yearly cost of bad loans and its hit to profit | NBFC-MFIs: 4.4% (September 2023) to 15.5% (September 2025), per the RBI |
| Expected loss | Probability of default × loss given default × exposure at default | Input for provisioning and pricing | See the worked example below |
Borrower capacity metrics
| Metric | How to calculate | Rule or reference point |
| Household repayment burden | Total monthly loan repayments ÷ monthly household income | RBI limit of 50% for microfinance households |
| Lenders per borrower | Count of active lenders on the bureau report | MFIN guardrail of three; 9.7% of borrowers had three or more (March 2026) |
| Total indebtedness | Outstanding microfinance and unsecured retail loans per borrower | MFIN guardrail of ₹2 lakh |
| First-instalment default | New loans missing the first EMI ÷ new loans disbursed | Flags fraud or weak underwriting; no published benchmark |
| Geographic concentration | Share of portfolio in your top states | Industry top ten states hold about 83% |
Worked examples (illustrative numbers):
- A lender with a ₹500 crore portfolio and ₹8 crore overdue 31–180 days has PAR 31–180 of 1.6% (8 ÷ 500), in line with the June 2026 industry level.
- A cohort with ₹100 crore exposure, a 3% probability of default and 80% loss given default carries expected loss of ₹2.4 crore (3% × 80% × ₹100 crore), or 2.4% of the cohort.
Review these by branch, state, loan cycle and disbursement month, not only in aggregate. An average can look healthy while one branch or vintage deteriorates.
Liquidity Risk in Microfinance
What It Is
Liquidity risk in microfinance is the danger that an institution cannot meet its short-term financial obligations, even if it is solvent on paper. Think of it as a cash flow timing problem rather than a solvency problem. A lender might have a healthy loan book, but if it cannot access cash quickly enough to repay its own lenders or fund new disbursements, it runs into trouble.
Where the Pressure Really Comes From
It is tempting to treat MFI liquidity as a classic asset-liability mismatch, with short-term borrowing funding longer loans. The data does not support that for NBFC-MFIs. ICRA found no mismatches up to at least a year in its August 2025 sector note, because borrowings run longer than the loans they fund. The RBI says more than two-thirds of NBFC loans and borrowings had maturities beyond 12 months at March 2025 (Business Standard).
The pressure came from funding risk instead: whether lenders could raise fresh money at all.
- Debt funding to microlenders fell from ₹1.30 lakh crore in FY24 to ₹85,877 crore in FY25, per the Bharat Microfinance report cited by Infomerics.
- MFIN blamed a continued funding squeeze for the sixth straight quarterly fall in the portfolio at September 2025.
- Small and medium MFIs saw bank funding fall about 70% between Q4 FY24 and Q3 FY26, according to MFIN.
- Slower collections compound this. When repayments dip, an MFI loses the cash it needs to service its own debt, and a breach of financial covenants can let lenders recall funds.
What Has Eased, and What Has Not
- The RBI reversed its extra 25-percentage-point risk weight on bank loans to NBFCs from 1 April 2025, announced in February 2025.
- The government launched CGSMFI-2.0 on 20 March 2026, a guarantee of up to ₹20,000 crore on bank loans to NBFC-MFIs and MFIs, and extended it to 31 August 2026. Only ₹770 crore of loans had been sanctioned by 10 June 2026 (PTI).
- Funding received by NBFC-MFIs rose 91.4% year on year in Q1 FY27, across small, medium and large lenders (MFIN).
- Funding costs are now a watch item. The RBI raised the repo rate by 25 basis points to 5.50% on 7 October 2026, its first hike since February 2023 (Business Today).
Managing Liquidity Risk
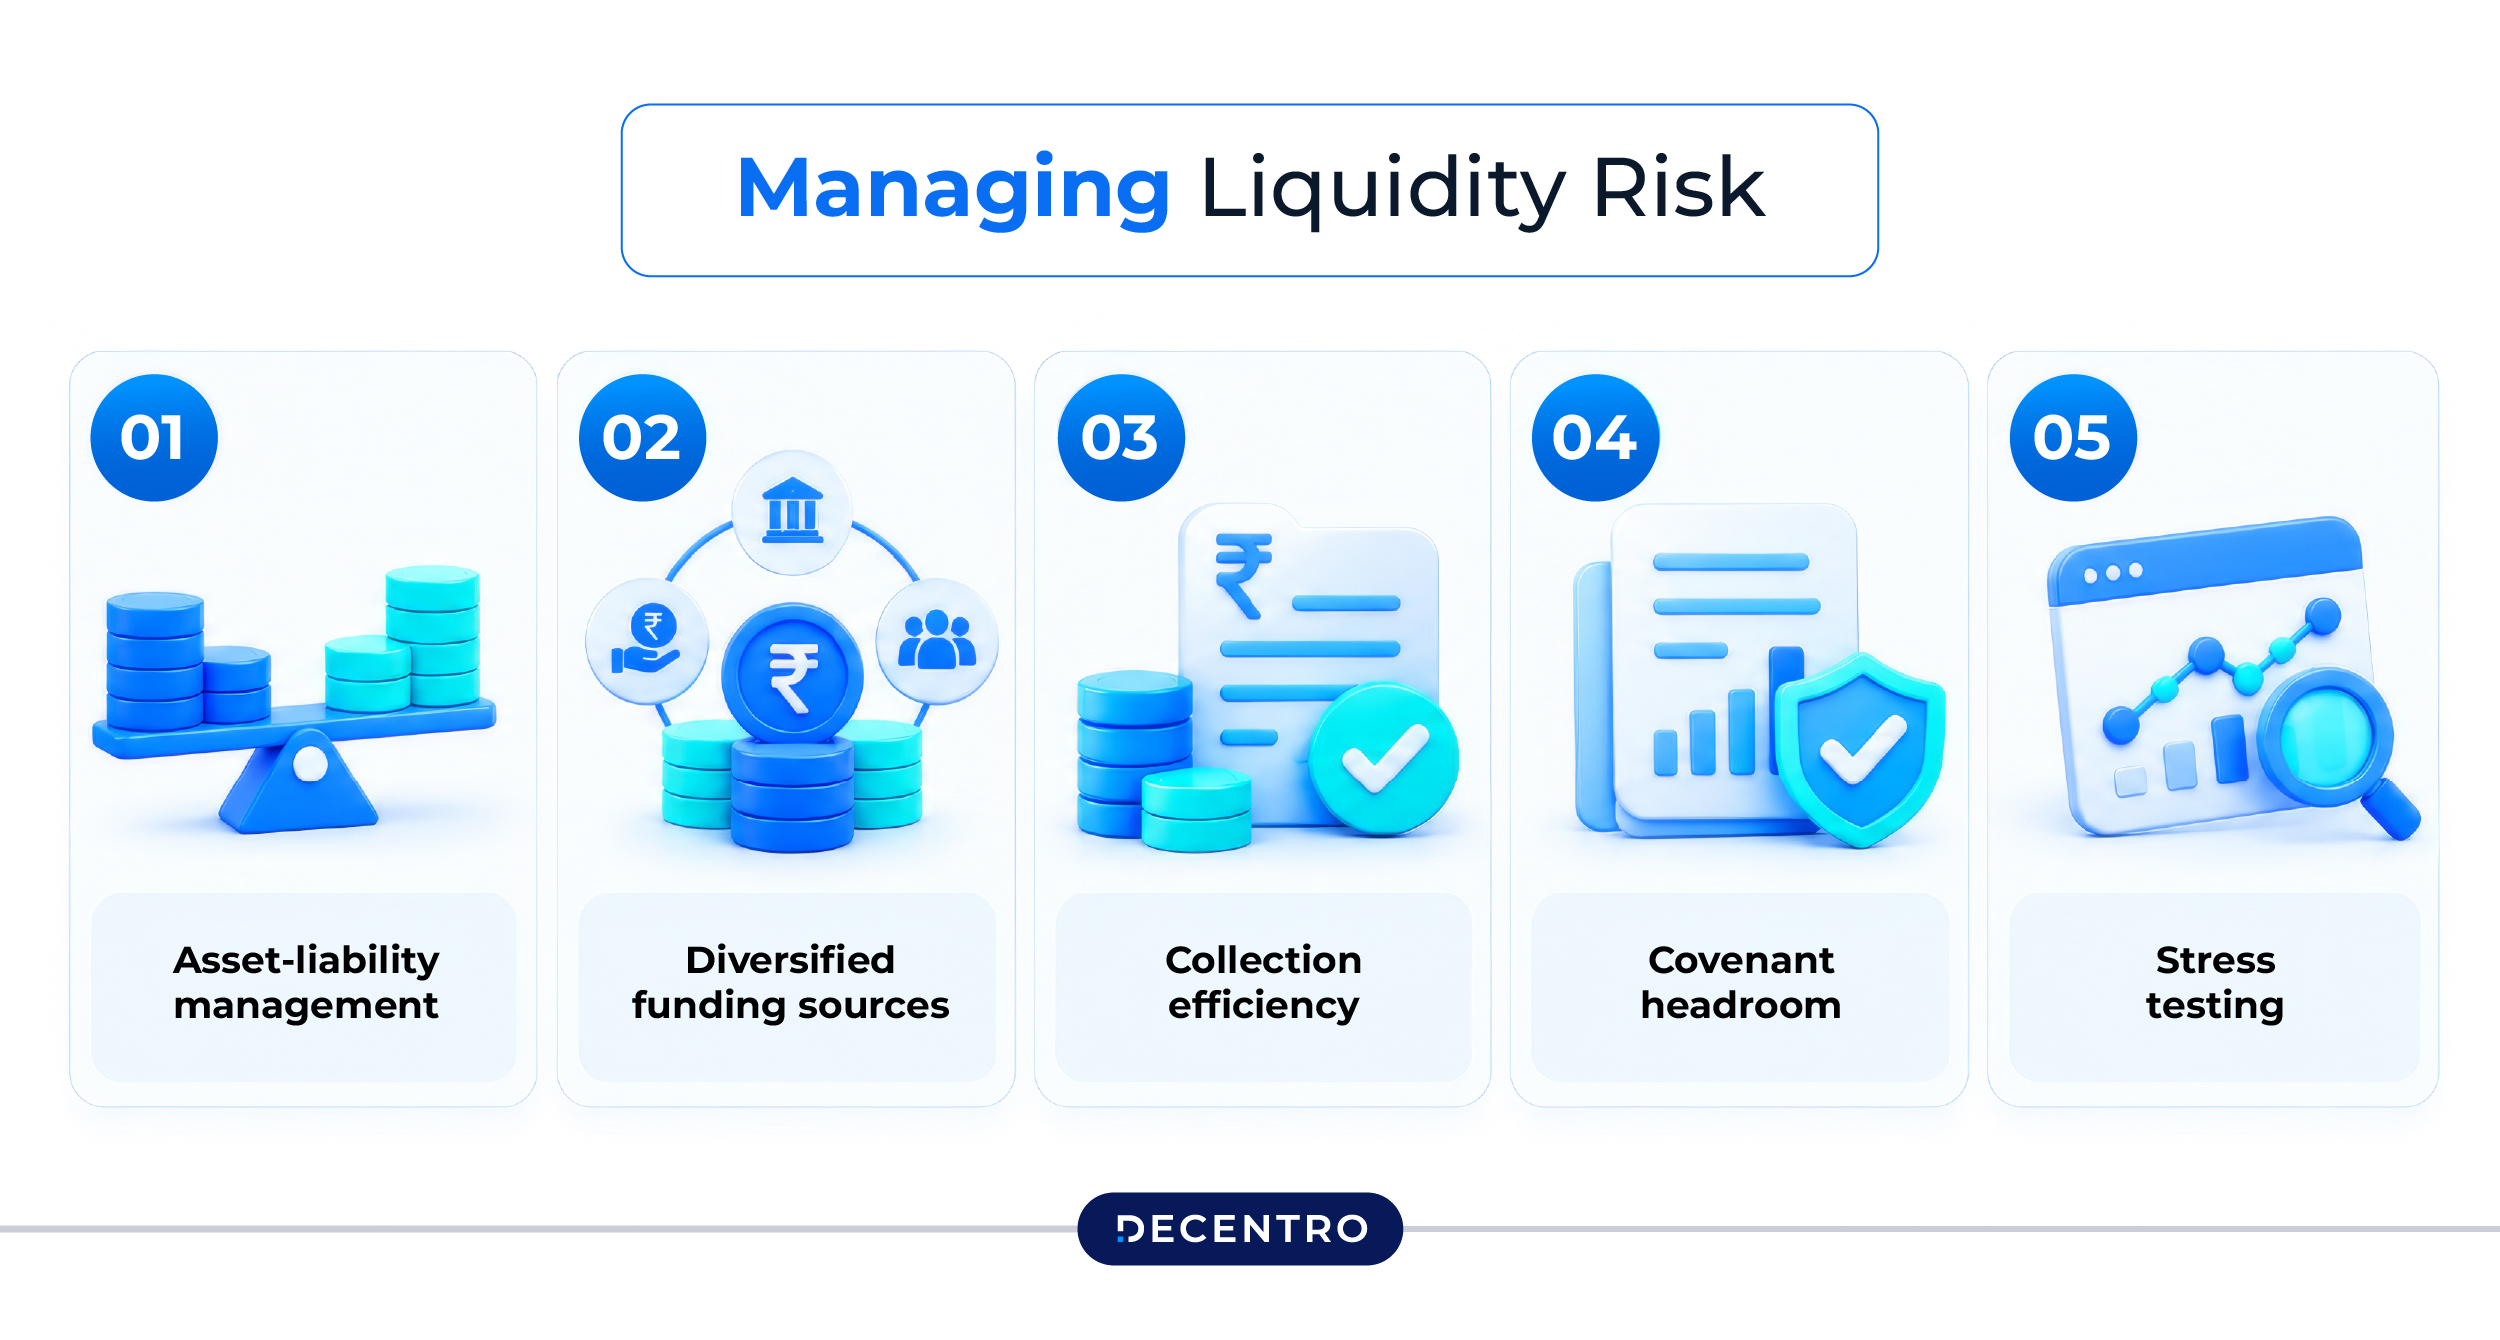
- Asset-liability management: align borrowing tenures and repayment dates with loan cash flows, and hold a buffer for months when collections dip.
- Diversified funding sources: rely on a mix of bank lines, NCDs, securitisation and equity rather than a single channel.
- Collection efficiency: this is the biggest lever. Faster, steadier collections directly shrink the cash crunch that triggers stress.
- Covenant headroom: track how close you are to every financial covenant before a breach, not after.
- Stress testing: regularly model what happens if collections drop by 10%, 20% or 30%, so leadership is not caught off guard.
Why It Matters
A liquidity crunch can turn a temporary rough patch into an existential crisis within weeks. In December 2025 the RBI’s Financial Stability Report said the sector had consolidated but that some stress persisted and needed close monitoring. For founders, liquidity planning cannot be an afterthought. It belongs next to your growth targets on the boardroom table.
Operational Risk in Microfinance
What It Is
Operational risk covers losses arising from failed internal processes, people, systems or external events. In practice it is everything that is not a borrower defaulting or the institution running out of cash. It is the quiet risk that does not make headlines until something goes badly wrong.
Common Sources
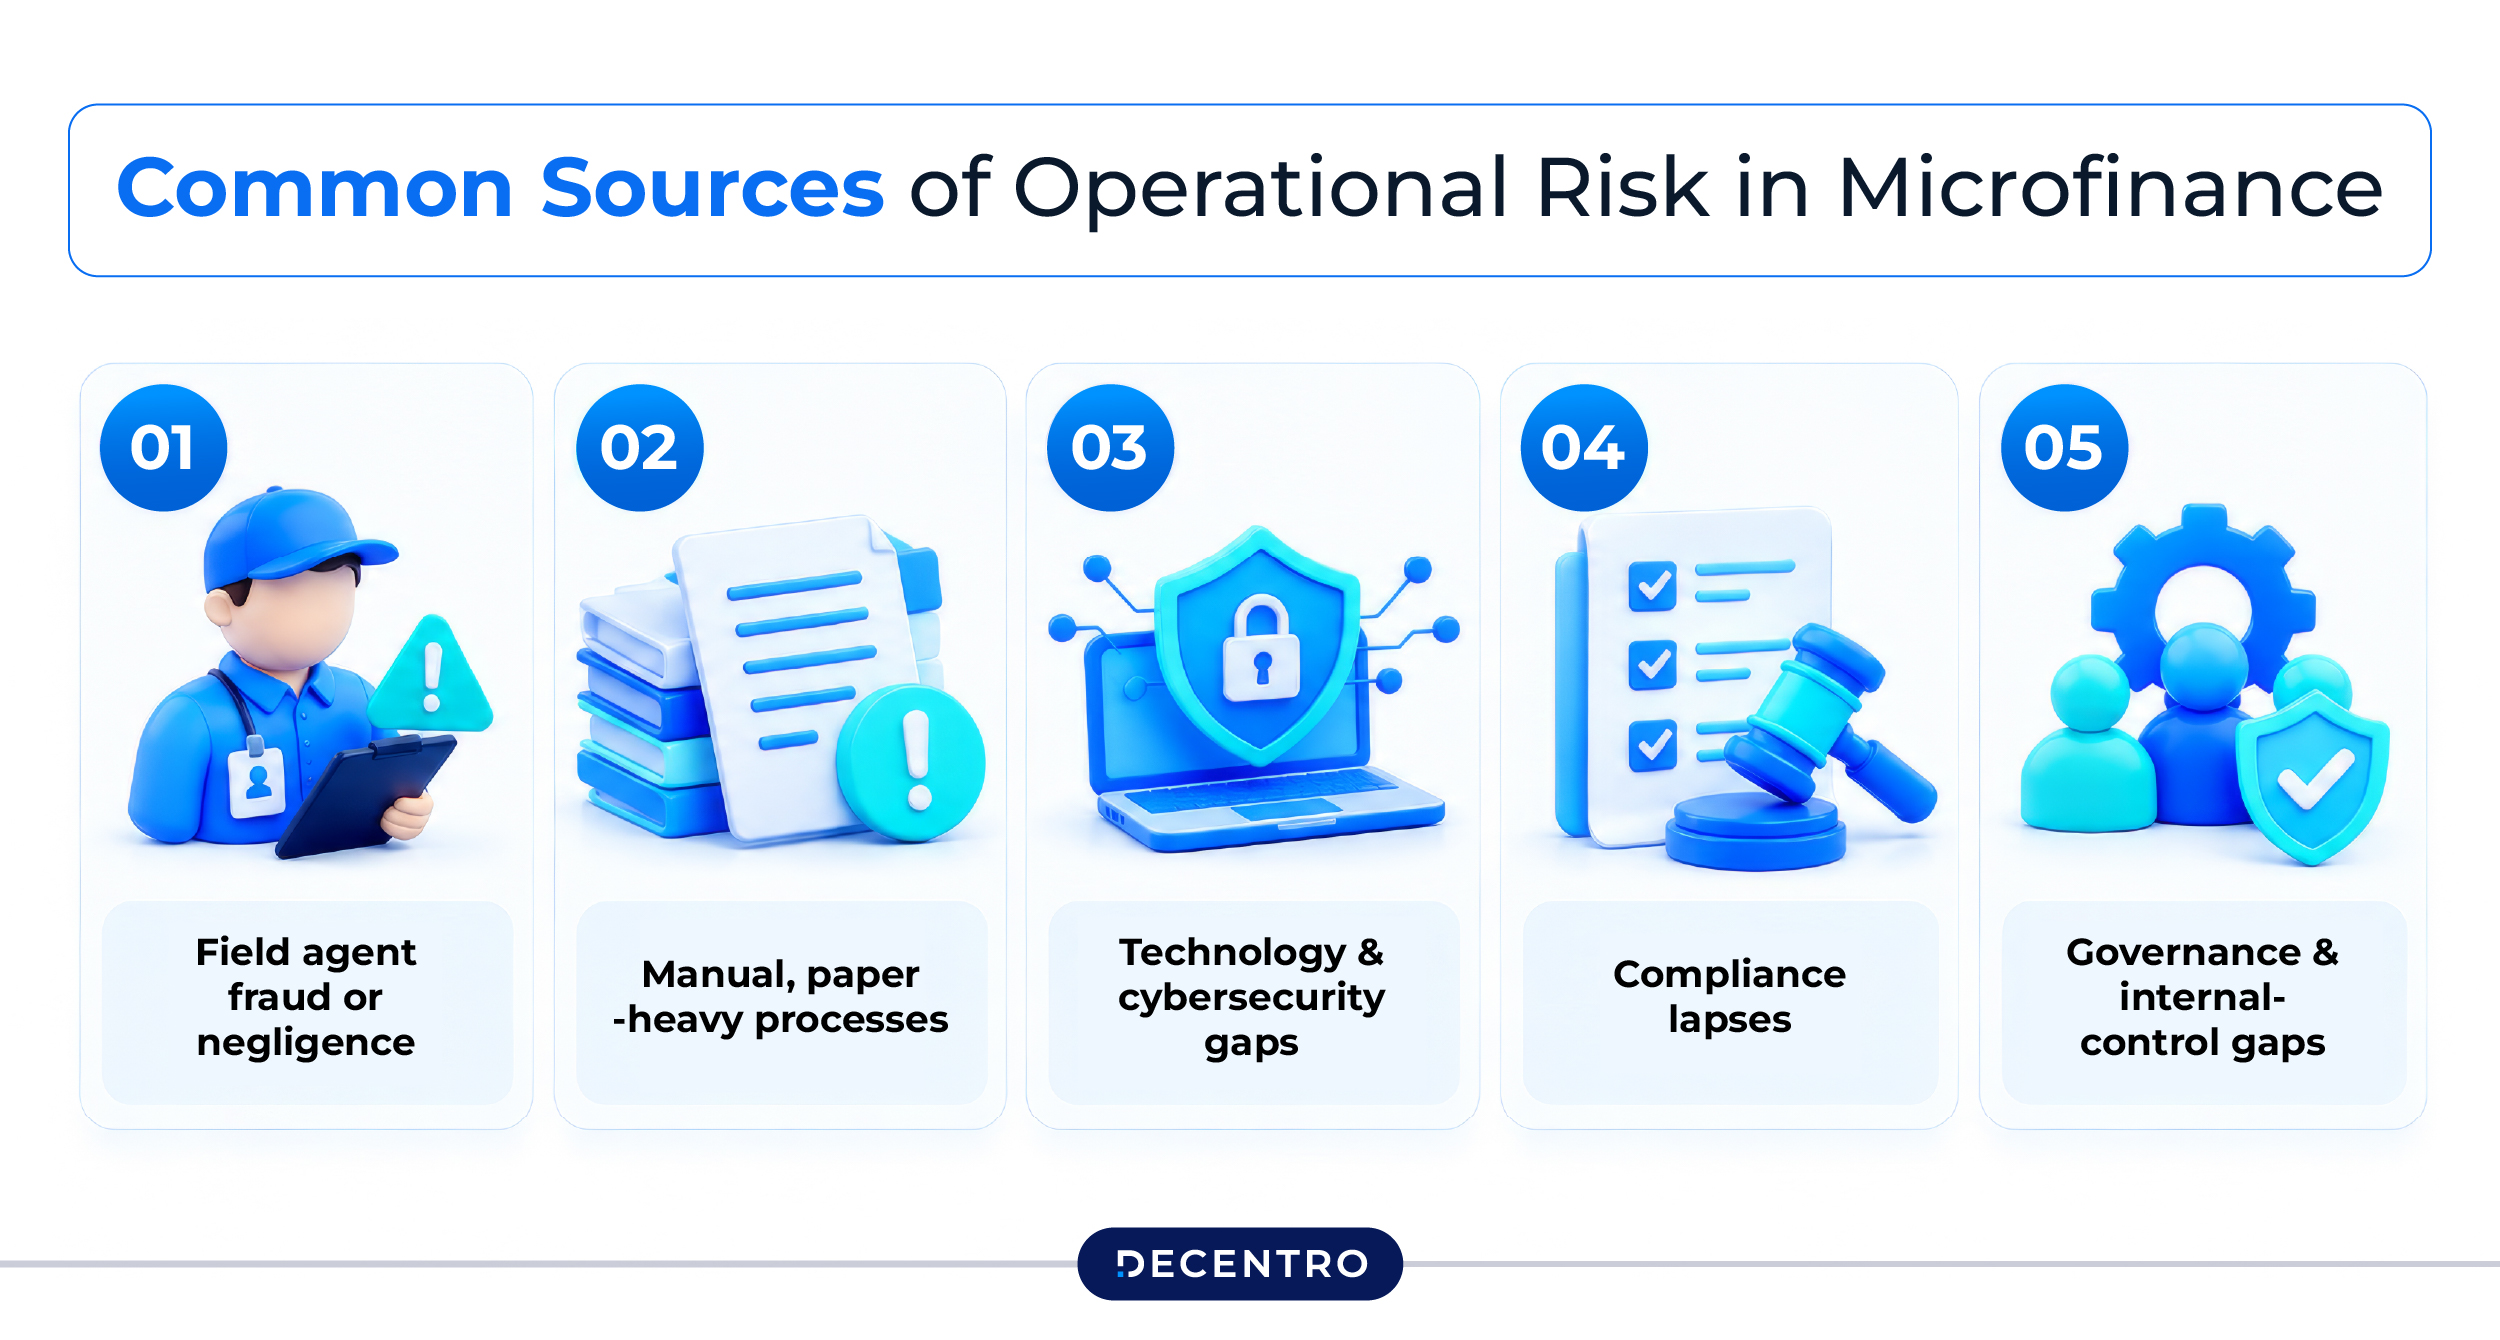
- Field agent fraud or negligence: microfinance relies heavily on human touchpoints in the last mile, so one dishonest or poorly trained agent can do disproportionate damage, from misreported collections to fake loan applications.
- Manual, paper-heavy processes: physical KYC verification and manual data entry are slow, error-prone and hard to audit.
- Technology and cybersecurity gaps: as lending moves digital, weak systems become an easy target for fraud, data leaks and transaction failures.
- Compliance lapses: in October 2024 the RBI barred four NBFCs, two of them NBFC-MFIs (Asirvad Micro Finance and Arohan Financial Services), from sanctioning or disbursing loans over excessive pricing and lapses in household income and repayment-obligation checks. All four restrictions were lifted by 8 January 2025 (RBI), but the episode shows how a process failure becomes a business-threatening event.
- Governance and internal-control gaps: Infomerics lists sector enforcement actions covering pricing, borrower assessment, credit bureau checks, recovery practices and internal controls.
How To Measure Operational Risk
Operational risk is measured with key risk indicators (KRIs): ratios you track every month by branch and field officer, so problems surface before they turn into credit or liquidity losses.
| Key risk indicator | How to calculate | What it signals |
| Cash-in-transit and cash-handling exceptions | Cash exceptions (late deposits, shortfalls, unreconciled cash) per 1,000 cash collections | Leakage, fraud or weak cash controls |
| KYC rejection and mismatch rates | KYC applications rejected or showing data mismatches ÷ applications processed | Weak onboarding, document fraud or data-entry errors; a sudden fall can mean checks are being skipped |
| Field staff attrition | Field staff leaving in the year ÷ average field headcount | Training gaps and collection pressure; inexperienced staff raise error and fraud risk |
| Customer complaints per 1,000 loans | Complaints received ÷ active loans × 1,000 | Poor conduct, coercive recovery or disclosure failures, and regulatory exposure |
| Audit findings per branch | Audit findings, weighted by severity, ÷ branches audited; count repeat findings separately | Where controls are failing; repeat findings mean an unresolved weakness |
| Share of cashless collections | Collections received by UPI, bank transfer or other digital channels ÷ total collections | A higher share means less cash theft and misreporting risk, and a cleaner audit trail |
Set thresholds from your own history, then flag any branch that drifts from the portfolio average. Read these alongside credit metrics. A branch with high KYC mismatches and rising PAR points to an onboarding problem, not just a collections one.
The Process Check
Operational risk is best managed through a continuous loop rather than a one-time fix.
- Identify: map every process, from onboarding to collections, and flag where human error or fraud is most likely.
- Digitise: replace manual, paper-based steps with automated, auditable digital workflows wherever possible.
- Monitor: track the key risk indicators above on live dashboards, so anomalies such as a sudden spike in cash collections at one branch are caught before they snowball.
- Train and audit: regularly train field staff and run surprise audits, since most operational failures trace back to a gap in training or oversight.
Why It Matters
Operational risk is often underestimated because it does not show up as a single dramatic number the way NPAs do. But it is frequently the root cause behind credit and liquidity problems too. A fraudulent application that slips through weak KYC eventually becomes a bad debt. A collection recorded incorrectly eventually becomes a cash flow gap. Fixing operational risk is often the highest-leverage place to start.
The Regulatory Picture: What Has Changed
Regulation now works on three layers: the RBI’s principle-based framework, self-regulatory guardrails and, increasingly, state laws. Founders need to track all three.
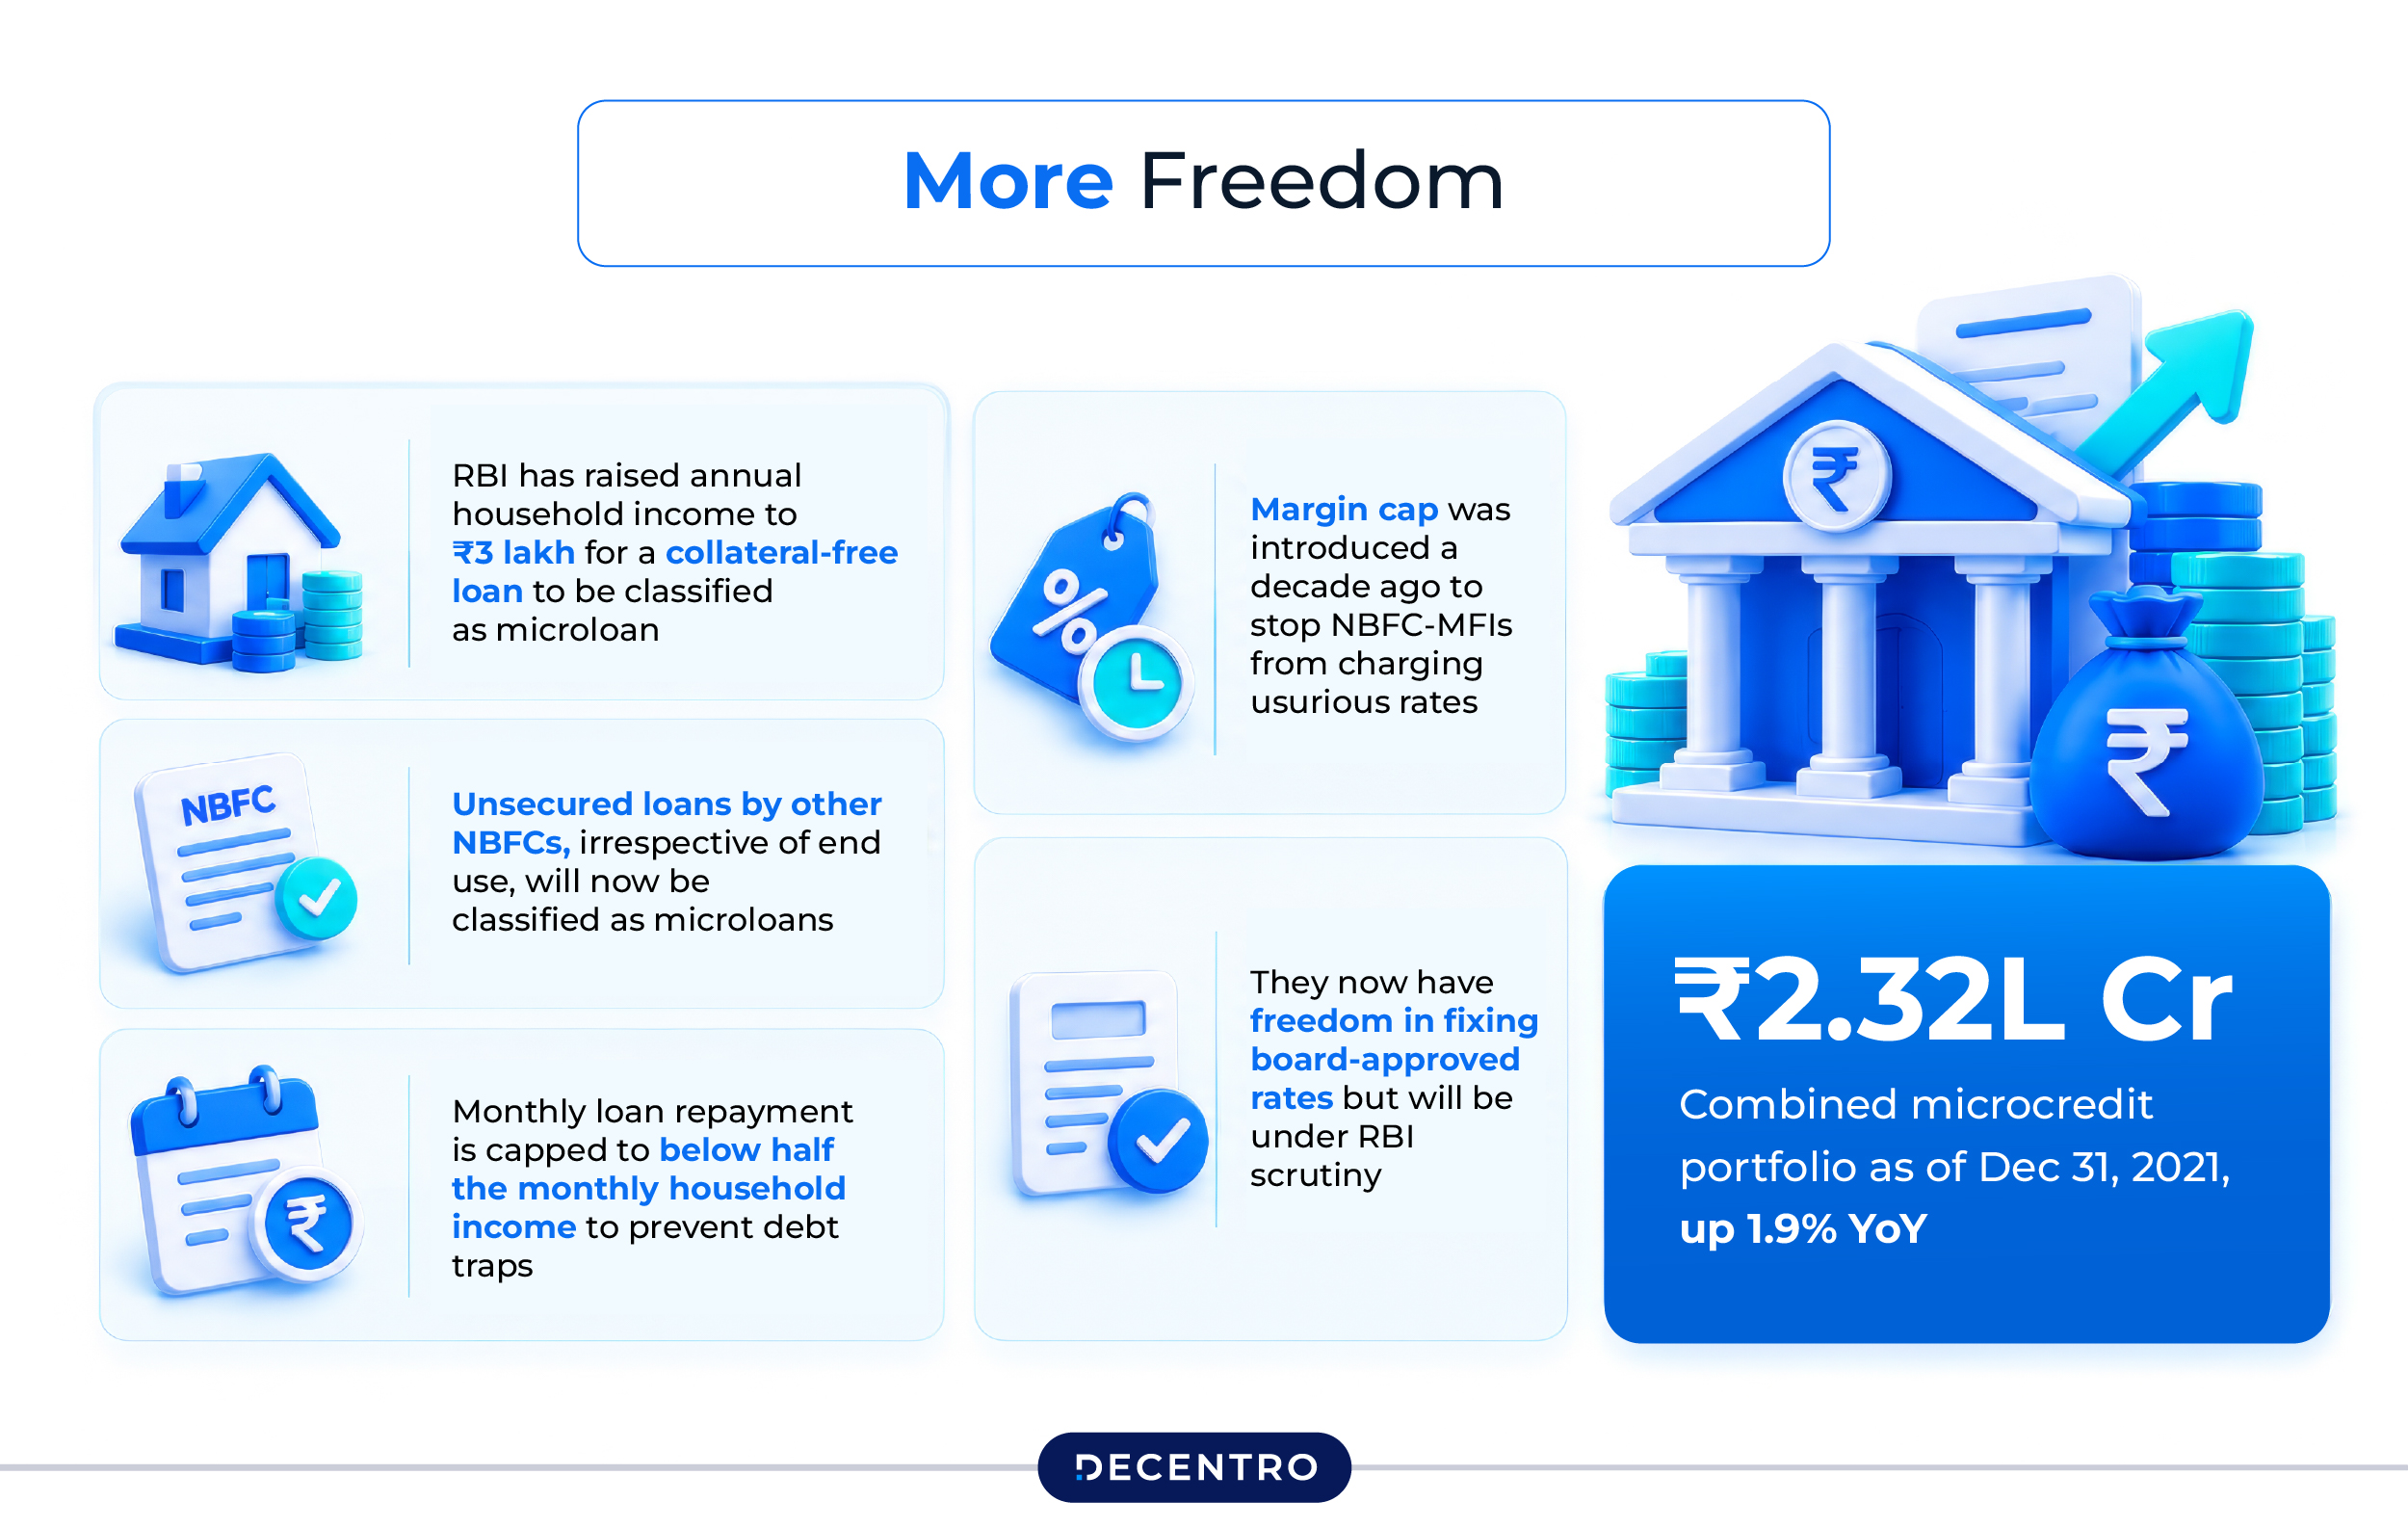
- RBI framework: the Regulatory Framework for Microfinance Loans, in force since April 2022 and updated in July 2025, replaced interest rate caps and a lender-count limit with a household test. A microfinance loan is a collateral-free loan to a household earning up to ₹3,00,000 a year. Total household loan repayments are capped at 50% of monthly income, and each lender must have a board-approved income assessment policy.
- Self-regulatory guardrails (MFIN and Sa-Dhan): from January 2025, with the lender cap effective 1 April 2025, borrowers are limited to three lenders and ₹2 lakh of total indebtedness including unsecured retail loans. Apart from processing fees and credit life insurance, no other charges may be deducted from the sanctioned amount (Business Standard). MFIN reported 98% of clients within its guardrails at September 2025.
- RBI enforcement: the October 2024 actions on pricing and income assessment showed that supervisors will name and restrict lenders that fall short. The RBI later credited the 2022 framework and the SRO guardrails with helping the sector grow in a calibrated way.
- State laws: regulatory moves in Karnataka and Tamil Nadu raised operating complexity for lenders. Bihar’s Micro Finance Institutions (Regulation of Money Lending and Prevention of Coercive Actions) Bill, 2026, passed on 26 February 2026, requires prior state permission to disburse, limits borrowers to two MFIs and bars coercive recovery. MFIN reads the Bill as not applying to RBI-regulated lenders such as banks and NBFC-MFIs, though its borrower-protection and fair-recovery provisions apply to all lenders (MFIN).
- Open questions with the RBI: MFIN says loans are shifting from microfinance to retail bureau reporting and wants the ₹3 lakh household income threshold reviewed, since it was last set in 2022.
The direction of travel is clear: regulators want steadier, more responsible growth, and they are willing to penalise institutions that do not fall in line.
Bringing It Together: Why This Should Change How You Build
Credit, liquidity and operational risk are not three separate problems for three separate teams. They feed each other. Weak onboarding checks create operational risk, which becomes credit risk, which becomes liquidity strain when collections dry up. MFIN credits its guardrails and a shift towards borrowers with an established credit history for much of the improvement in portfolio quality since FY25.
That makes the first and last steps of the loan lifecycle the best places to invest.
- Onboarding: Decentro’s KYC and onboarding APIs let lenders verify identity through CKYC, DigiLocker and AI-powered document checks in seconds rather than days. That targets the KYC mismatch rate tracked above. Its Scanner product adds document and face verification with liveness and forensic checks, aimed at the fraud that later shows up as credit losses.
- Collections: Neowise, an AI-powered debt collection platform that Decentro acquired in 2023, covers collections from early-stage outreach to legal resolution. Its NeoBot voice bot automates calling at scale and NeoSight analyses collection calls. Strong collection efficiency is the lever that protects against both credit and liquidity stress.
For founders weighing where to invest first, the honest answer is onboarding and collections. Get those two right with the right technology partners, and a large share of your credit, liquidity and operational risk becomes easier to manage.
Conclusion
Microfinance remains one of the most powerful tools for financial inclusion, but FY25 was a hard reminder that growth without risk discipline does not last. Credit risk, liquidity risk in microfinance and operational risk are deeply interconnected. In FY25 PAR 31–180 roughly tripled to about 6%, gross NPAs reached about 14.8% of loans, and the portfolio then contracted for seven straight quarters.
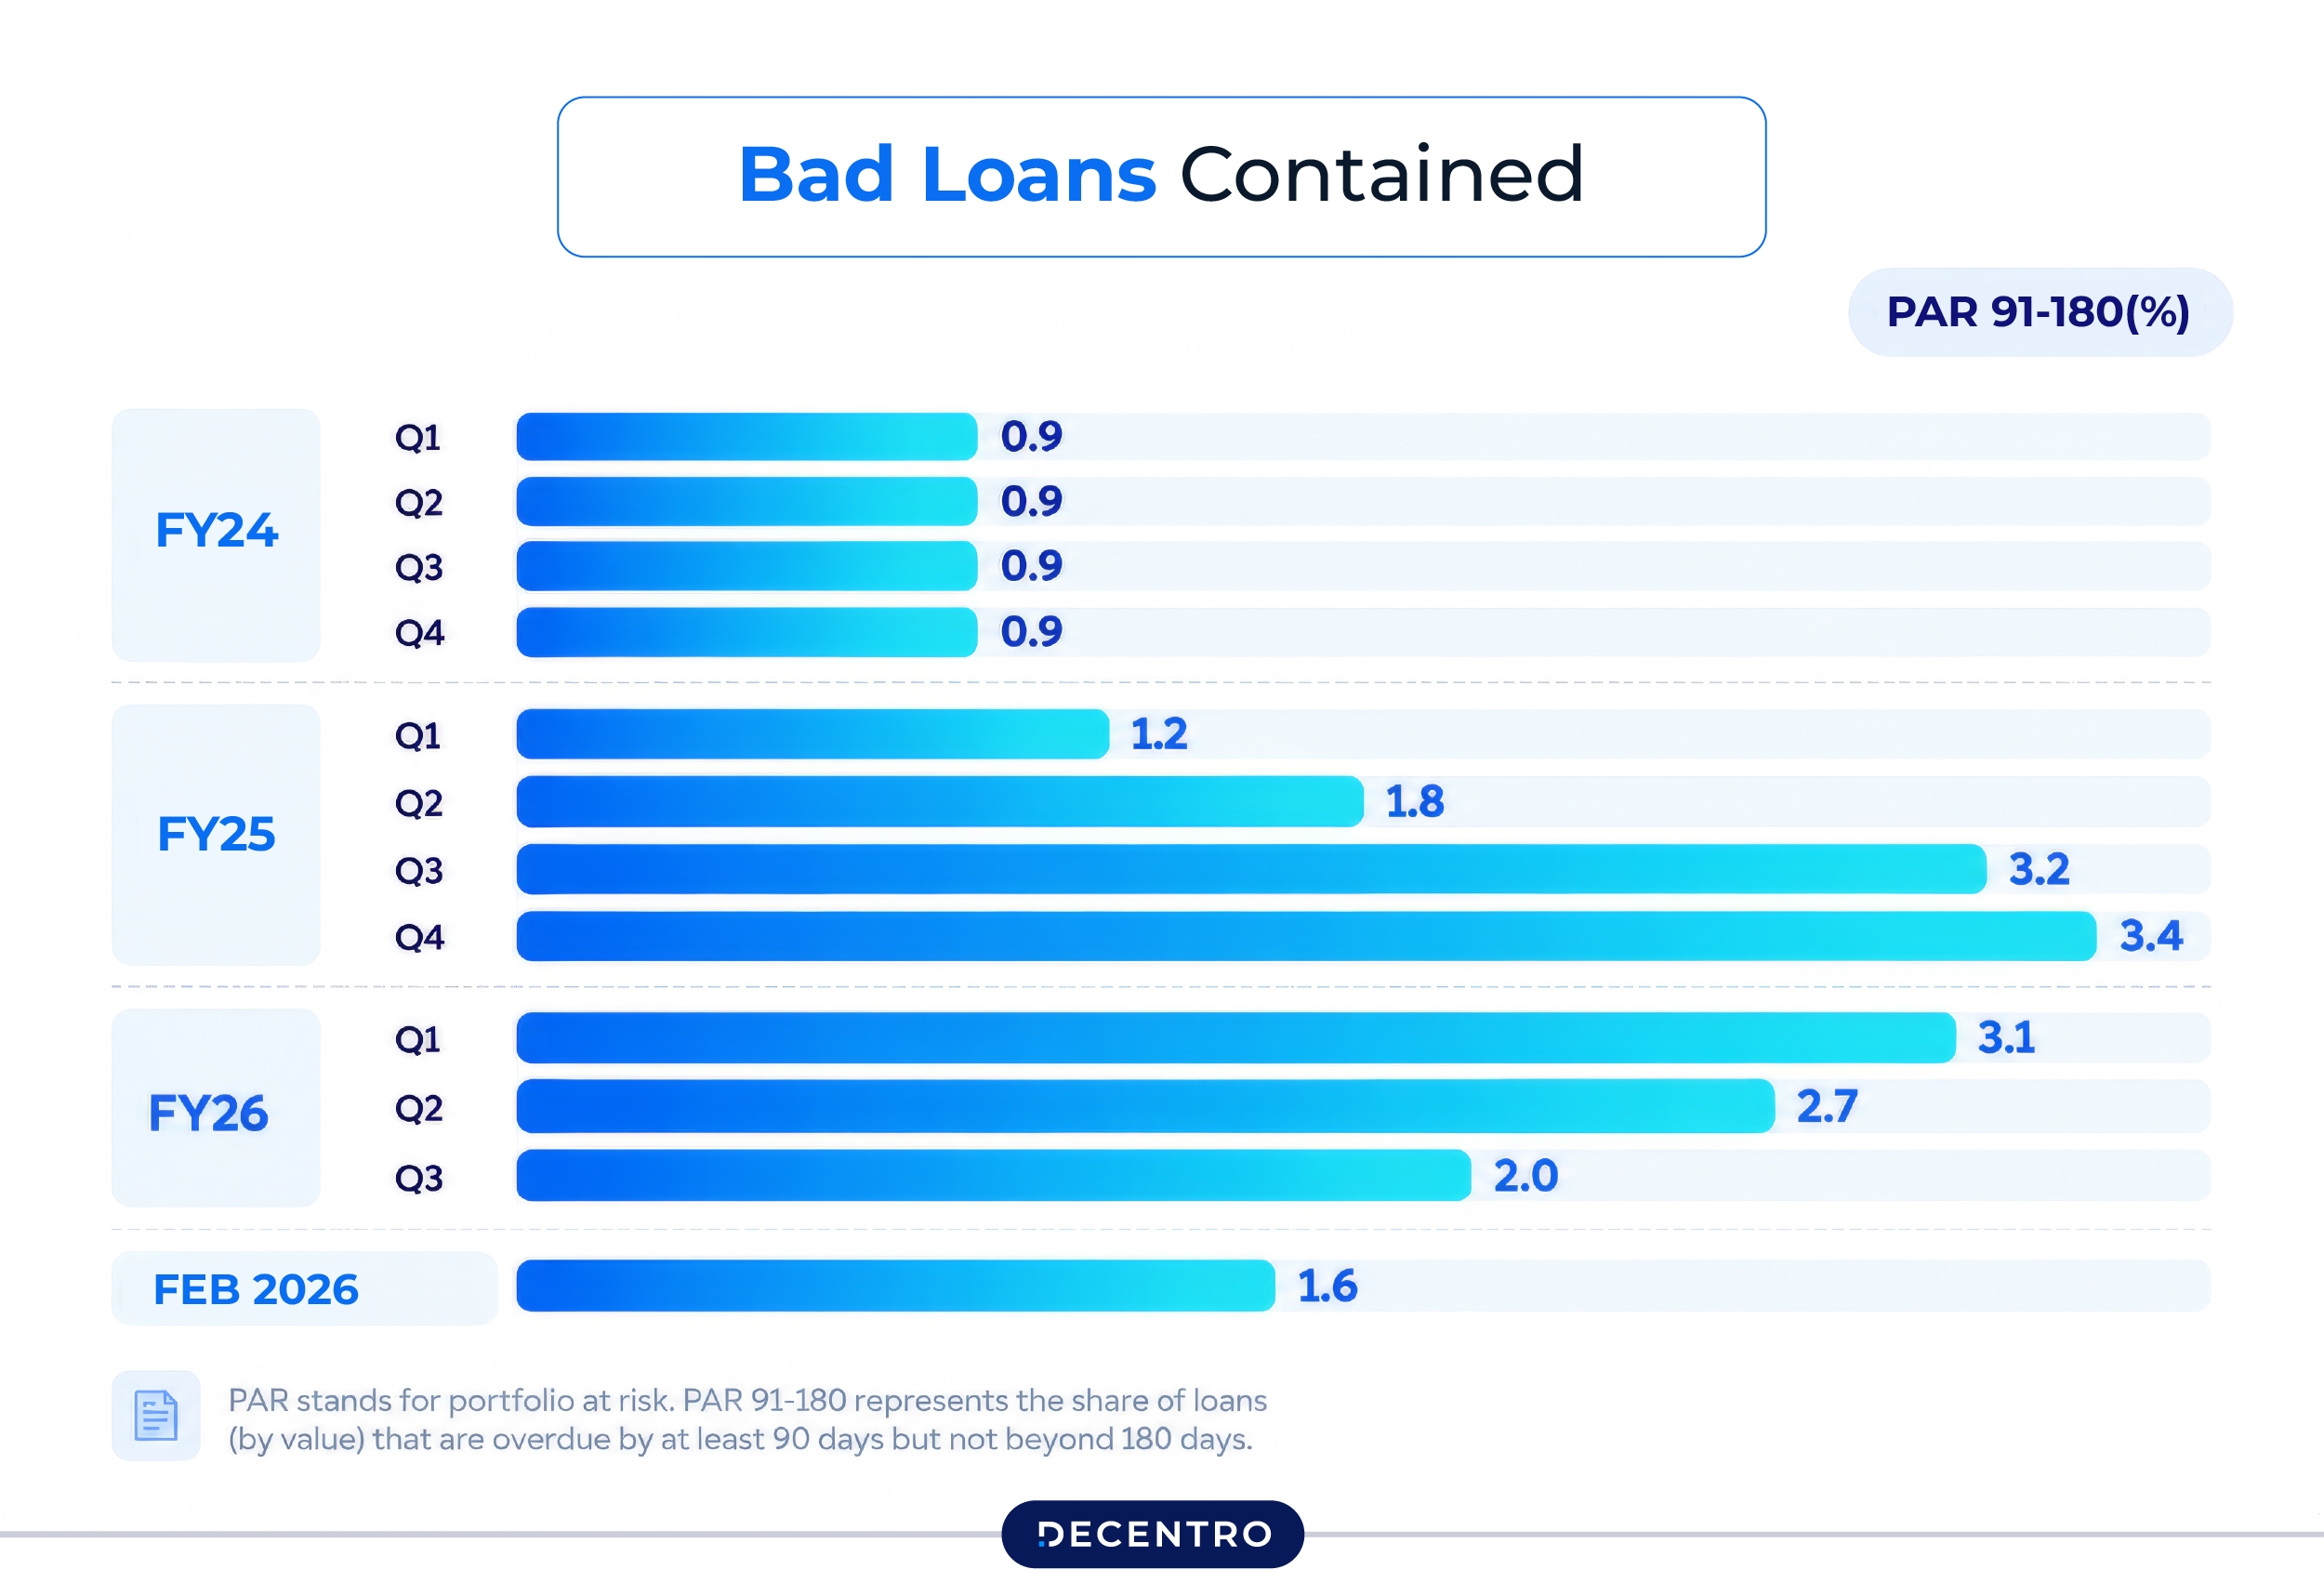
The recovery since is real. PAR 31–180 had fallen to 1.6% by June 2026 and the loan book is growing again. It is not yet broad-based, because borrower numbers are still shrinking, lending is concentrated in a few states and funding costs have started to rise.
None of these risks are unmanageable. With sharper underwriting, tighter funding and collections planning, cleaner operations and the right technology for onboarding and collections, lenders can build a microfinance business that grows steadily instead of boom-and-bust. Treating risk management as a growth strategy, not a compliance checkbox, is what will set you apart.
Frequently Asked Questions
What are the main types of risk in microfinance?
The main types are credit risk (borrowers not repaying), liquidity risk (the lender running short of cash for its own obligations) and operational risk (failures in processes, people, systems or external events). MFIs also face interest rate, market, strategic, reputational and regulatory risks, but these three cause most losses.
How does liquidity risk differ from credit risk in an MFI?
Credit risk is about borrowers failing to pay. Liquidity risk is about the lender lacking cash at the right time, even with a healthy loan book. They are linked, because slow repayments cut the cash an MFI needs to repay its own lenders. In FY25 and FY26 the biggest liquidity pressure came from tighter funding rather than a mismatch between loan and borrowing tenors.
How is credit risk measured in microfinance?
The core measure is PAR 31–180, the share of the portfolio 31 to 180 days overdue. It stood at 1.6% in June 2026 against a peak of 6.3% at March 2025. Lenders also track PAR by bucket, the gross NPA ratio, roll rates, collection efficiency and credit cost, alongside borrower limits such as the RBI’s 50% household repayment cap and the three-lender guardrail.
Is microfinance still risky in India in 2026?
Less than at the FY25 peak, but not low. PAR 31–180 fell from 5.6% to 1.6% between June 2025 and June 2026, and the portfolio is growing again. Remaining risks include a shrinking borrower base, concentration in a few states, growth through larger loans to repeat borrowers, higher funding costs after the October 2026 repo rate hike and state-level regulation.
How can MFIs reduce operational risk?
Track key risk indicators: KYC mismatch rates, cash-handling exceptions, field staff attrition, complaints per 1,000 loans, audit findings per branch and the share of cashless collections. Then digitise KYC and collections, train field staff and run surprise audits.